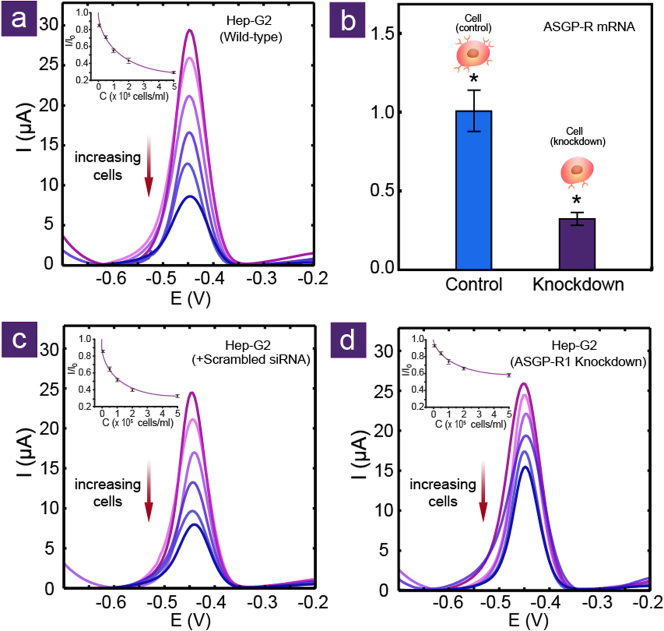
Figure 5. Probing the sugar-based ligand-receptor interactions with a biomimetic interface by DPV.
DPVs of SPEs confined with GO-GA2 in the absence (top curves) and presence of incremental (a) wild-type Hep-G2 cells, (c) control Hep-G2 cells and (d) si-ASGP-R1/Hep-G2 cells (Insets: current decrease ratio, where I0 is the initial current and I the decreased current in the presence of, from top to bottom, 5,000, 10,000, 100,000, 200,000 and 500,000 Hep-G2 cells/mL). (b) Expression level of ASGP-R1 mRNA of Hep-G2 cells in the presence of a scrambled (control) or a gene-specific siRNA (knockdown) evaluated by quantitative real-time polymerase chain reaction (*P < 0.003).

