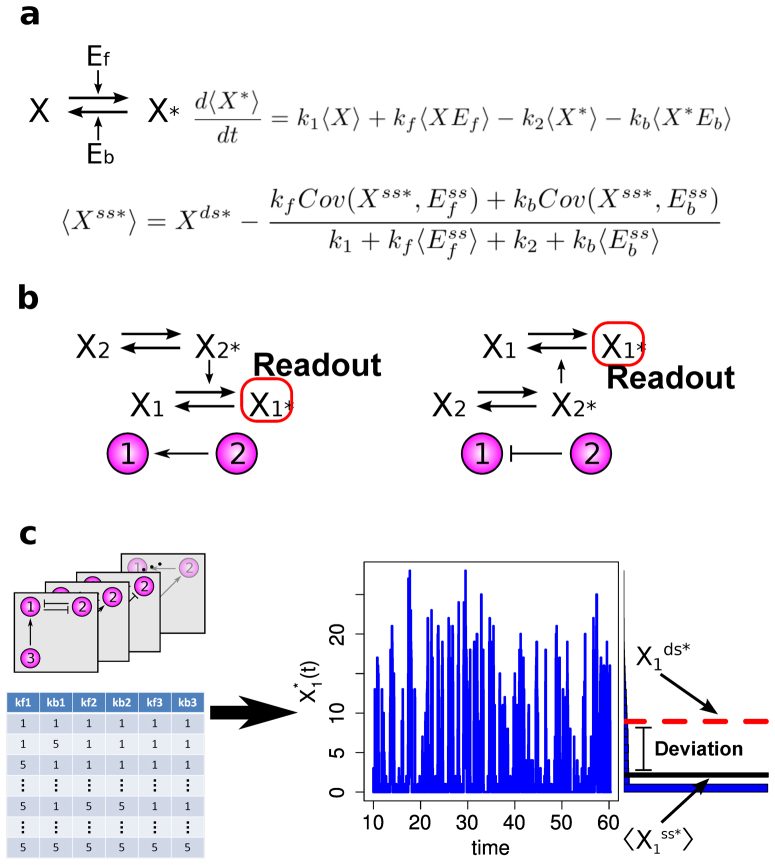
Figure 1. A bottom-up approach to analyze architectural features of deviant effects.
(a) The structure, the mean time evolution, and the steady-state average of the network based on a single two-state protein. Here, X is the inactive form of the protein; X* is the active form of the protein; Ef is the enzyme to catalyze the activation of the protein; and Eb is the enzyme to catalyze the inactivation of the protein, while k1 and k2 are the basal activation and inactivation rate constants and kf and kb are the catalytic activation and inactivation rate constants. The superscript ss indicates the steady-state (stationary) random variable whereas the superscript ds indicates the deterministic steady state. (b) An illustration of how enzymatic circuit models are built from the signaling protein motif. Activation of node 1 by node 2 is shown on the left. The active form of the protein in node 2 is used as the enzyme to catalyze the activation of the protein in node 1. Inhibition of node 1 by node 2 is shown on the right. The active form of the protein in node 2 is used as the enzyme to catalyze inactivation of the protein in node 1. (c) An illustration of our framework to analyze the topological features that give rise to deviant effects from simulation of a range of enzymatic circuit models. Networks are generated using a set of constraints (see Materials and Methods), and each node has a set of parameter values. From these the steady-state average of the active form of node 1 is computed for the stochastic model and the corresponding deterministic model, and the deviation level is measured.

