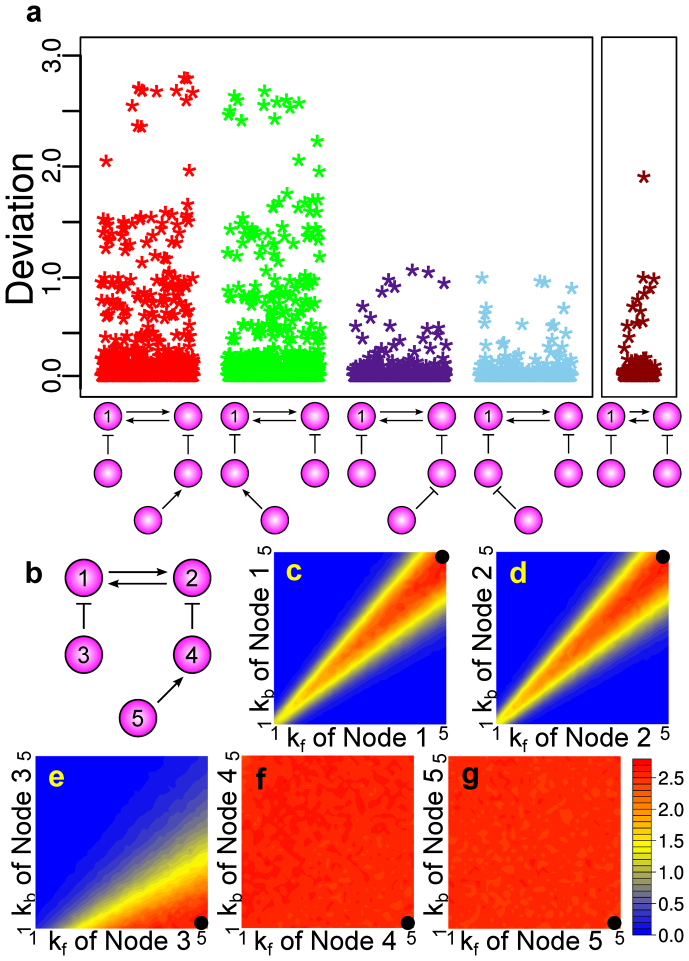
Figure 3. The five-node networks with the highest levels of deviation.
(a) The distributions of the deviation levels from the top four network topologies compared with the distribution of the deviation levels from the four-node topology with the highest deviation potential. Each of the five-node topologies here represents two isomorphic networks with respect to node 1. (b) A specific five-node topology with the highest deviation levels used for sensitivity analysis. (c)–(g) Sensitivity analysis. Heatmap plots showing how the deviation level changes based on changes in parameters in a particular node while keeping the parameters of the other nodes fixed. The black circles indicate the base parameter values.

