
Fig. 2.
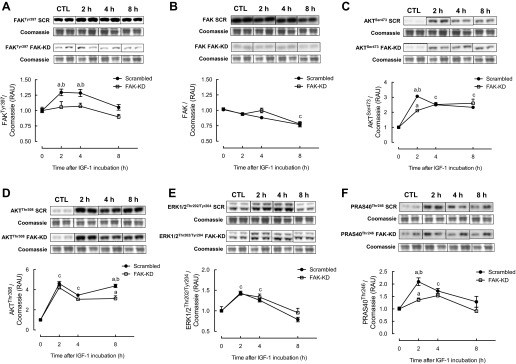
Changes in phosphorylation of FAK (A), total FAK protein expression (B), phosphorylation of Akt (C and D), extracellular signal-related kinase 1/2 (ERK1/2; E), and proline-rich Akt substrate of 40 kDa (PRAS40; F) in response to IGF-I treatment in FAK vs. scrambled shRNA C2C12 cells. Data are presented as relative arbitrary units (RAU) ± SE normalized to Coomassie staining of the membrane (n = 12 replicates/group). aP < 0.05 vs. respective basal group; bP < 0.05 between groups at that time point; cP < 0.05 from basal at that time point for both groups.