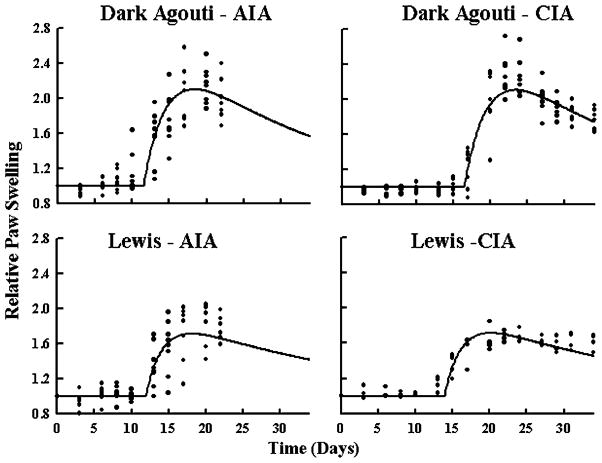
Fig. 3.
Arthritis disease progression as indicated by changes in paw swelling. Circles depict observed paw size relative to baseline values. The solid line is the population prediction for all points in each group, assuming no residual error. There are data from four rats (eight paws) in all plots except for the Lewis rats with CIA, n=2 (four paws).

