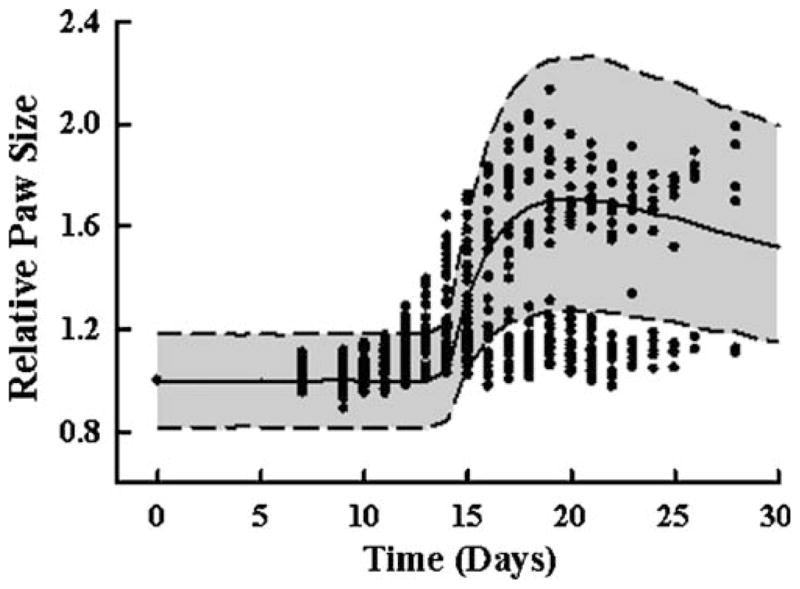
Fig. 4.

Arthritis disease progression model prediction of paw and ankle edema. Additional paw measurements were available from a time course of disease progression in 34 Lewis rats with CIA. Circles depict observed paw sizes. The solid line is the median prediction for each time point from a simulation of 10,000 rats, applying the model developed for Lewis rats with CIA. The shaded area is the 10th to 90th confidence interval.
