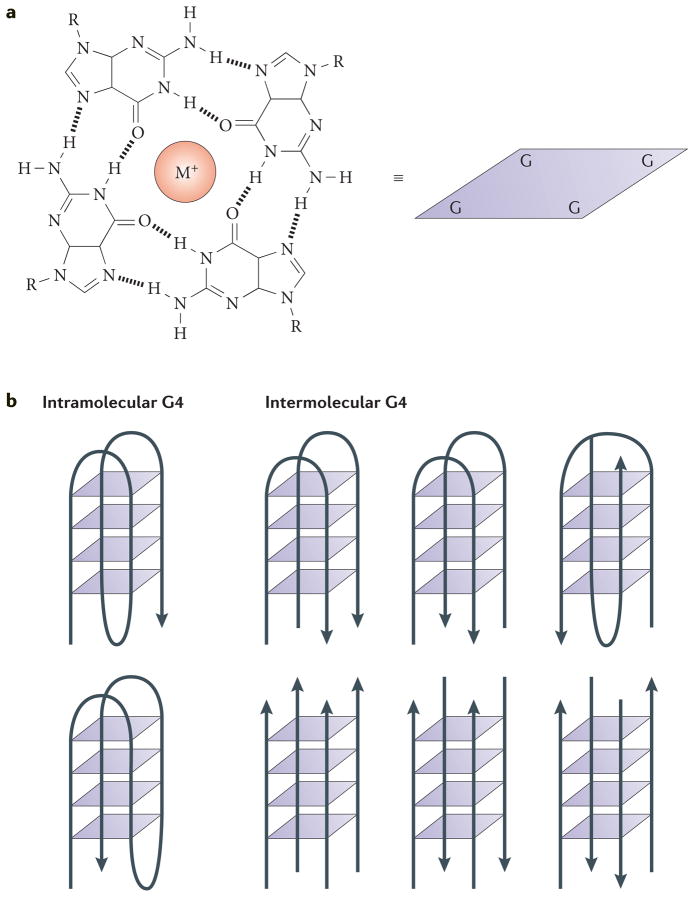
Figure 1. G-quadruplex DNA.
a | An illustration of the interactions in a G-quartet. This quartet is represented schematically as a square in the other panels of this figure. M+ denotes a monovalent cation. b | Schematic diagrams of intramolecular (left) and intermolecular (right) G-quadruplex (G4) DNA structures. The arrowheads indicate the direction of the DNA strands. The intermolecular structures shown have two (upper) or four (lower) strands.

