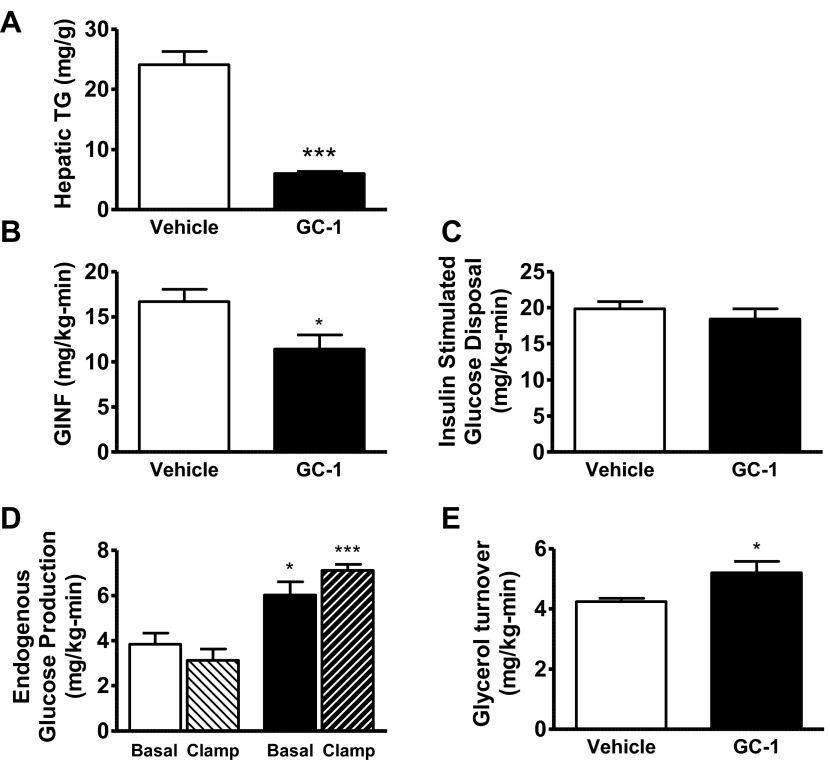
Fig. 1.
Physiological comparison between 10 days GC-1 treatment (filled bars) vs. vehicle (open bars). A: hepatic tissue triglyceride (TG) content. B: glucose infusion rate (GINF) during hyperinsulinemic period of hyperinsulinemic-euglycemic clamp. C: whole body insulin-stimulated glucose disposal. D: endogenous glucose production under basal (open bars, vehicle; filled bars, GC-1) and clamped (light hatched bars, vehicle; dark hatched bars, GC-1) conditions. E: basal glycerol turnover (*P < 0.04 vs. vehicle; ***P < 0.0004 vs. vehicle).

