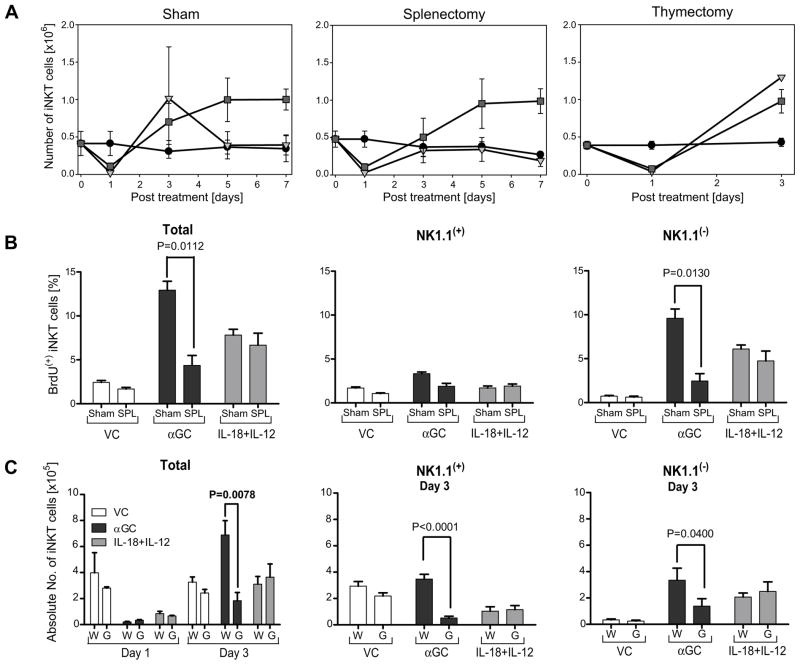
Figure 4. iNKT cell expansion in the liver caused by αGC or IL-18+IL-12 treatment utilized different mechanisms.
(A) Liver leukocytes from sham control, splenectomized and thymectomized mice treated with VC, αGC or IL-18+IL-12 were analyzed for the number of iNKT cells by FCA at indicated times as described in figure 1. Line graph of sham and splenectomy experiments for days 0, 1 and 3 represent 9 individual animals from 3 independent experiments and days 5 and 7 represent 3 individual animals. Line graph for thymectomy experiment represent 4 animals from 2 individual experiments. The symbol and error bar depict mean ± standard error. (B) Proliferating iNKT cell NK1.1(+/−) subset analysis. Sham control (Sham) and splenectomized mice (SPL) were treated with VC, αGC or IL-18+IL-12 on day 0 and BrdU on days 1 and 2. On day 3 the proliferating NK1.1(+) and NK1.1(−) iNKT cells was determined using FCA of the percent of iNKT cells that incorporated BrdU. Bars depict mean ± standard error representing 6 individual animals from 2 independent experiments. (C) Wild type (W) and IFNγ(−/−) mice (G) were treated with VC, αGC or IL-18+IL-12 and then on days 1 and 3 leukocytes were isolated from the liver and total iNKT cell numbers or on day 3 NK1.1(+) and NK1.1(−) iNKT cell numbers were determined as described in figure 1. Bars depict mean ± SEM representing 9 individual animals from 3 independent experiments.

