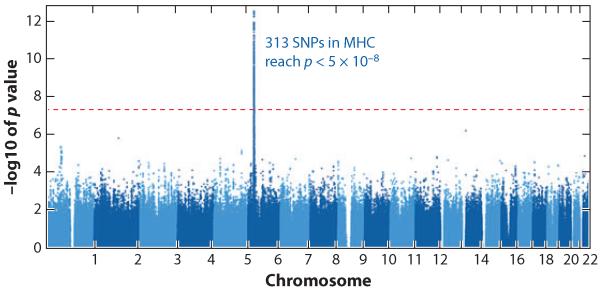
Figure 2.
Manhattan plot of data derived from 974 HIV controllers and 2,648 progressors. Shown are p-values for 1,384,048 data points derived from comparing each measured single-nucleotide polymorphism (SNP) in HIV controllers versus progressors. 313 SNPs reach statistical significance in this population of European ancestry, appearing as a line, which is defined by p < 5 × 10⁻⁸ because of the need to correct for multiple comparisons. All significant SNPs lie within the major histocompatibility complex on chromosome 6.

