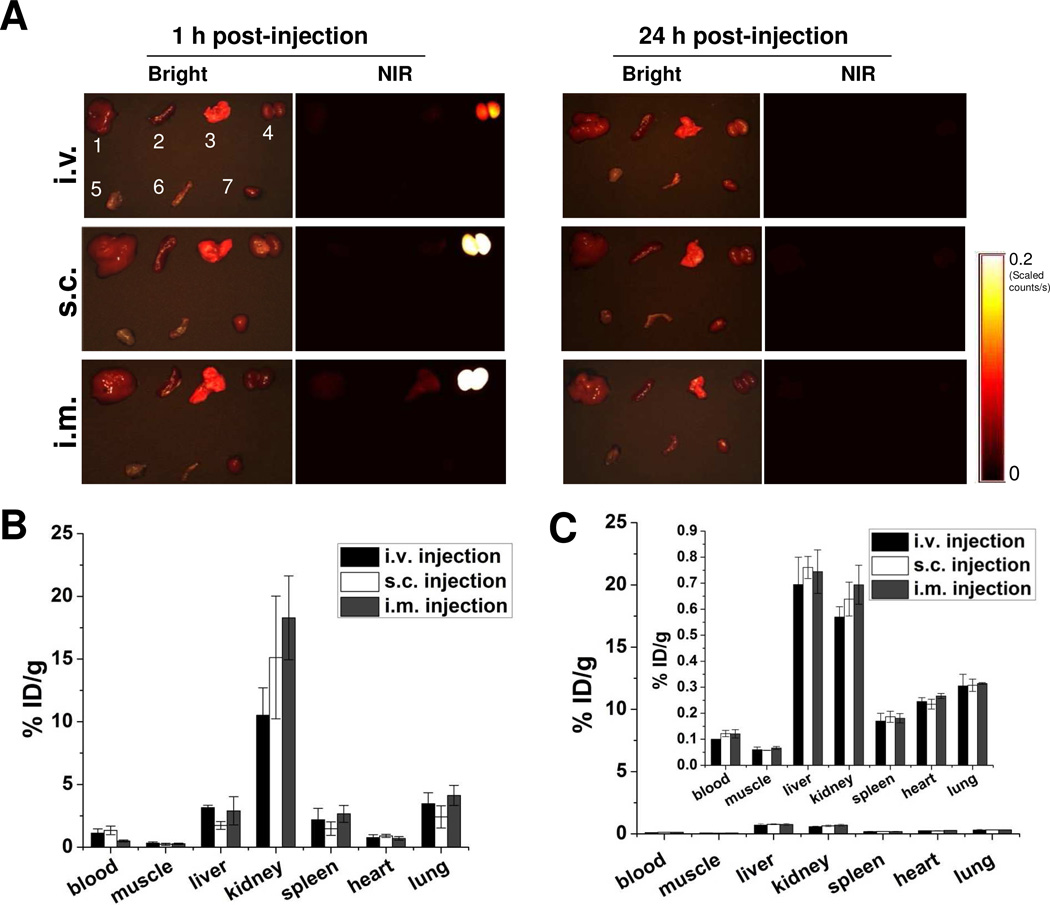
Figure 4.
Biodistribution of particles after three injection routes. (A) Ex vivo imaging of biodistribution of C-dot particles. After injection of particles, the major organs and tissues were harvested from Balb/C mice at the indicated time points, and subsequently, the bright field and NIR imaging were acquired using a Maestro imaging system. Left, 1 h post-injection (top, i.v.; middle, s.c.; bottom, i.m.); right, 24 h post-injection (top, i.v.; middle, s.c.; bottom, i.m.). Bright field: 1, liver; 2, spleen; 3, lung; 4, kidneys; 5, muscle; 6, intestine; 7, heart. (B-C) Quantification of the biodistribution of 64Cu labeled C-dots via three injection routes at 1 h (B) and 24 h (C) time points. At 1 h and 24 h postinjection of 64Cu-C-dot, the mice were euthanized and major organs and tissues including blood, muscle, liver, kidneys, spleen, heart and lung were harvested and measured by gamma counting.

