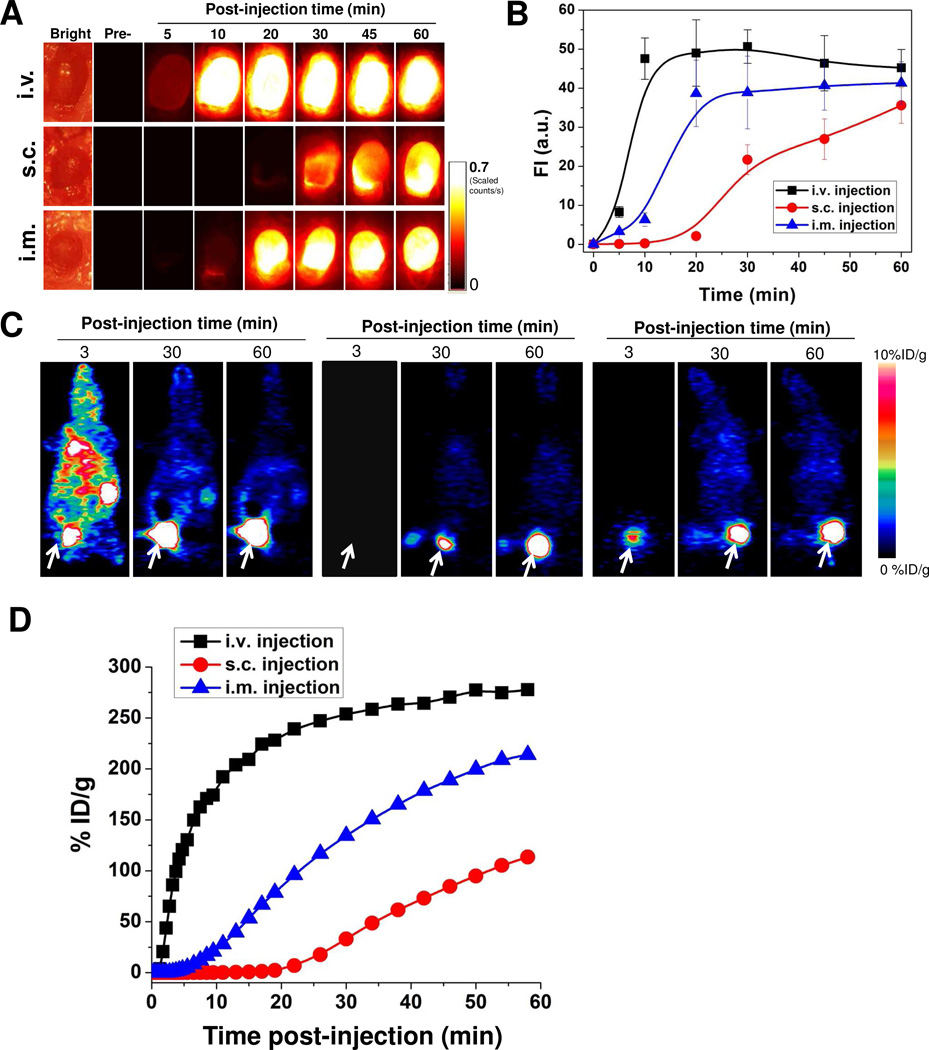
Figure 5.
Urine accumulation of C-dot-ZW800 after different routes of injection. (A) The mice were kept under isoflurane anesthesia and the bladder was exposed and NIR images were acquired at the indicated time points before and after (top) i.v. injection, (middle) s.c. injection and (bottom) i.m. injection. (B) Quantification of the ZW800 fluorescence signal in (A). (C) Representative coronal images from 1 h dynamic PET imaging of 64Cu-C-dot after three routes of injection: left, i.v. injection; middle, s.c. injection; right, i.m. injection. (D) Urinary bladder ROI analysis of the PET images in (C).

