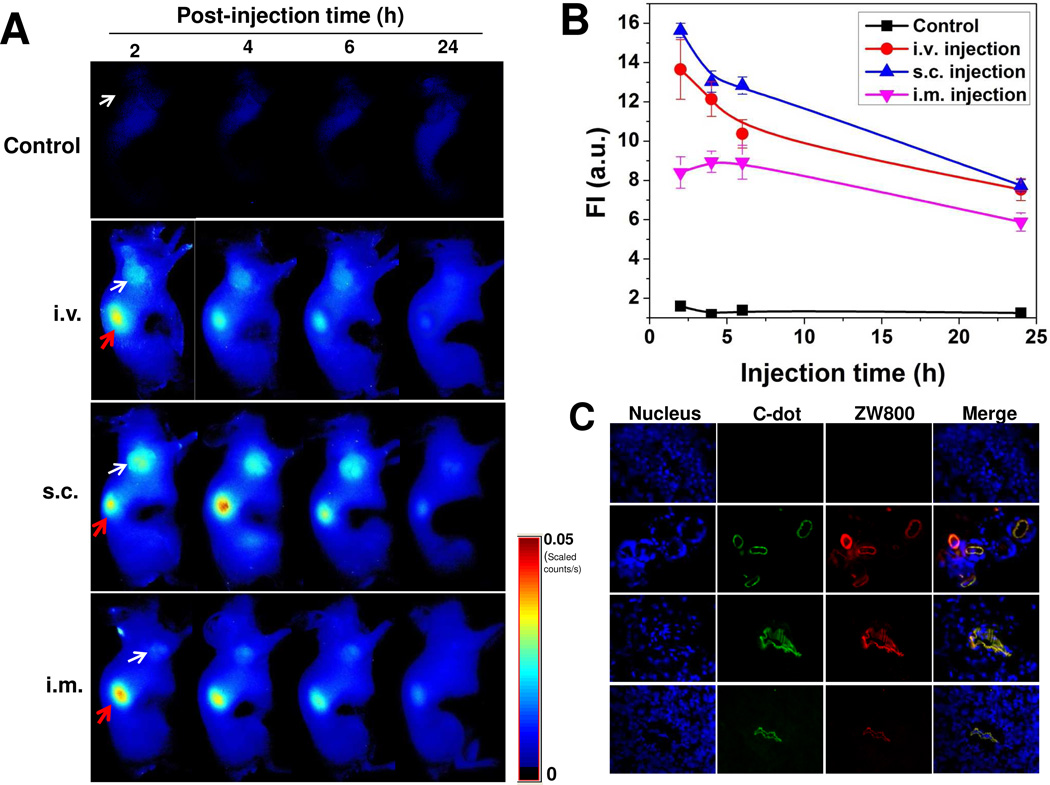
Figure 7.
Tumor uptake of C-dot-ZW800 after different routes of injection. (A) NIR fluorescence images of SCC-7 tumor-bearing mice acquired at 2, 4, 6 and 24 h postinjection: control (without injection), i.v. injection; s.c. injection; i.m. injection (white arrow indicates tumor; red arrow indicates kidney). (B) Tumor ROI analysis. Fluorescence signal unit: ×108 photons/cm2/s. (C) Ex vivo fluorescence images derived from the emission of C-dots and ZW800 were acquired to confirm tumor uptake of particles.

