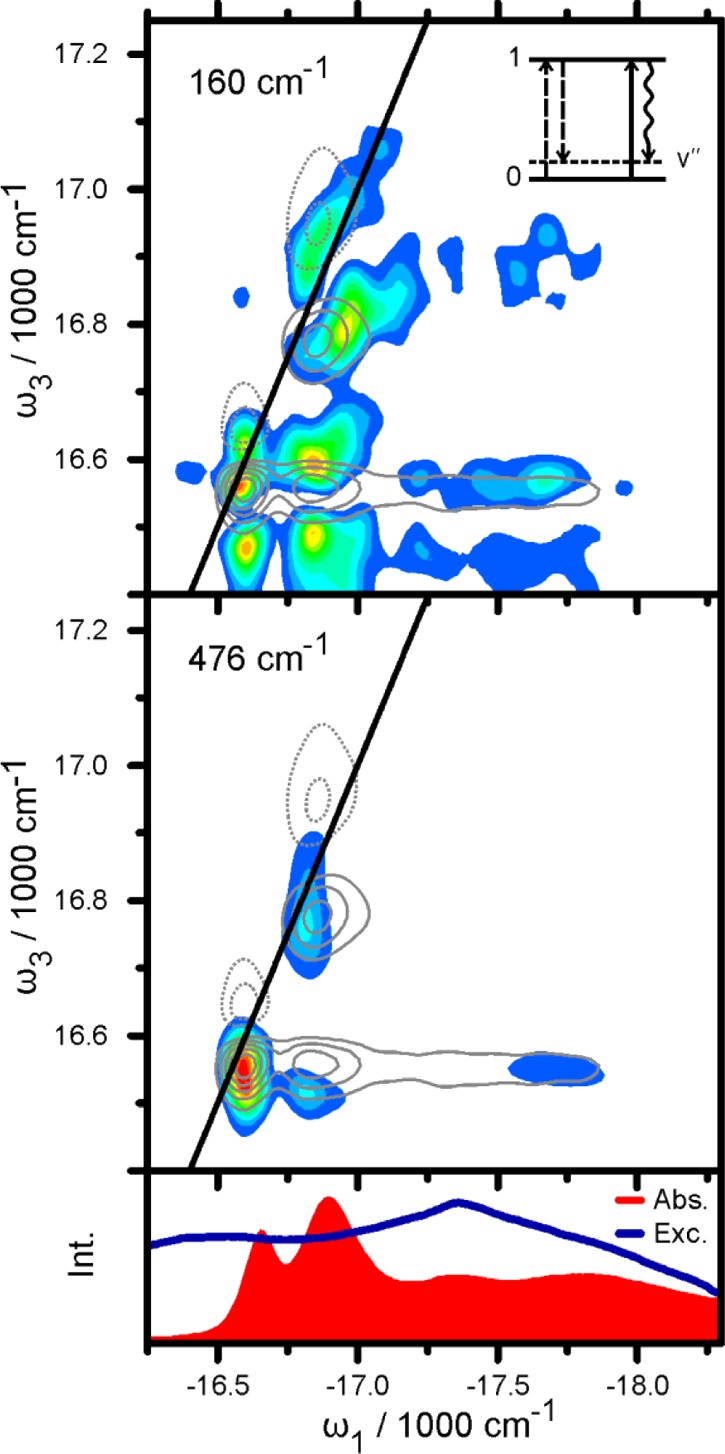
Figure 5.

FFT-amplitude maps of the oscillatory components at 160 cm–1 (top) and 476 cm–1 (bottom). The 2D map is shown in comparison as gray contour lines with full lines (dashed lines) for positive (negative) signals (see Figure 2 for comparison). The inset in the upper panel shows an energy ladder diagram explaining the peaks at ω3 ≈ 16470 cm–1. Electronic (vibrational) levels are depicted as horizontal full (dotted) lines. Bra-side and ket-side interactions and the resulting signal are shown as dashed, full, and wavy arrows, respectively. Absorption and excitation spectrum are shown in the lower panel for comparison.
