Abstract
To reduce imaging costs, we designed a head holder for scanning two rats simultaneously in small animal PET scanners. Our goals were (i) to maintain high sensitivity and (ii) to minimize repositioning error between scans.
Methods
A semi-stereotaxic dual rat head holder was designed and constructed for dual rat scanning in our IndyPET-II scanner and the commercial microPET P4. It was also used for single rat scanning in a small-bore, high-resolution animal scanner (“ISAP”). Positional repeatability was validated via multiple [11C]Raclopride scans of a single rat on different days. Accuracy of repositioning was determined by visual comparison of images, and by metrics derived through image alignment.
Kinetic validation was assessed via analysis of [18F]Fluorodeoxyglucose ([18F]FDG) dynamic PET studies of six rats. Each rat was scanned twice: once individually, with brain positioned at the center of field of view (CFOV), and once with a partner, with brain away from CFOV. Both rats were injected with FDG during each dual rat session. Patlak uptake constants (Ki) were calculated from whole brain images. Effects of attenuation and scatter correction on single versus dual scan images were explored.
Results
Image comparison and alignment metrics indicated excellent repositioning of rats. Scaled time-activity-curves from single and dual rat scans were indistinguishable. Average single and dual scan Ki values differed by only 6.3 ± 7.5%.
Conclusion
Dual rat scanning in a semi-sterotaxic holder is practical for economical small animal scanning and does not compromise kinetic accuracy of [18F]FDG dynamic scan data.
1. Introduction
Positron Emission Tomography (PET) is prized for its unique capability in imaging physiological processes in-vivo. Using molecularly specific tracers, PET images can be used to track the local kinetics of physiological processes by extracting time activity curves (TACs) from regions of interest (ROIs). Fitting models to TACs leads to estimation of physiologically relevant kinetic parameters. In preclinical studies, rodents are often scanned with small animal PET scanners. As the use of small animal PET proliferates, interest in high-throughput, quantitative imaging is growing.
A significant limitation of PET experiments is cost. PET scans of short lived tracers with moderate to low specific activity are particularly expensive because the radioactivity from a single synthesis is often insufficient or the mass too great to support a second tracer experiment. Functional studies that focus on repeated measures of activity concentration in small regions may suffer a second possible limitation. Repeatable positioning of the animal with respect to the field of view (FOV) is important to avoid subtle confounds due to the spatially varying response of the PET scanner (i.e., spatially variant point-spread-function). We addressed both concerns by designing and building a dual rat head holder to enable simultaneous scanning of two rats while maintaining repeatable repositioning of the brains from scan to scan.
Concomitant with the interest in small animal scanning is a great interest in holders and positional reproducibility ( Lecomte et al., 1994; Cherry et al., 1997; Jeavons et al., 1999; Hume and Myers, 2002; Myers and Hume, 2002). Previous work by Rubins et al. (2001) examined use of sharp and blunt ear bars in a single rat holder for repeatable positioning and recommended sharper ear bars for less positional variation. Tada et al. (2002) and Fricke et al. (2004) introduced holders that could be used in MRI scanners. Much of the work of other investigators in small animal scanning has been on slice or positional reproducibility within a single rat. Our focus has been on the feasibility of simultaneous dual rat scanning and positional repeatability.
Possible drawbacks of placing two rats simultaneously in a PET scanner include increased signal attenuation and scatter due to increased object mass in the FOV, and increased dead-time due to the doubling of injected activity within the scanner. To fit two rats simultaneously in a gantry, the brains have to be positioned away from the center of the field of view (CFOV), where performance of the scanner is optimal. As the subjects are moved away from CFOV, we can expect some loss of resolution and sensitivity. Loss of resolution could make it more difficult to identify small brain structures. Loss of sensitivity could lead to unwanted mass effects if additional injected activity were needed to achieve sufficient signal to noise ratio. Therefore, scanning two rats simultaneously could impact the quality of our images, and subsequently degrade the accuracy of the estimated kinetic parameters. We validated the dual rat head holder through comparisons of [18F]FDG uptake constants (Ki), derived from single and dual rat scans of the same rats in two small animal scanners, the IndyPET-II and the microPET P4. If the holder has only limited effects on Ki, we infer that it will have little effect on other kinetic parameters, such as those derived for neuroligand tracers.
Half of the rat holder can be used by itself to hold one rat (“single rat mode”). Repeatability of positioning a single rat was tested using the holder in single rat mode in a small-bore small animal scanner.
2. Materials and Methods
2.1. Holder Design and Fabrication
To assure repeatable positioning, the dual rat head holder was designed based on the concept of positioning a rat’s head via semi stereotaxic methods. That is, we chose to immobilize each rat using two ear bars that are inserted, one through each ear canal, and pressed against an indentation in the skull, and a bite bar over which the incisors are hooked. The dual rat holder, based partly on the Kopf Model 900M (David Kopf Instruments, Tujunga, CA), is comprised of four ear-bars, four ear-bar supports (two for each rat) on which the ear-bars rest, four ear-bar clamps which hold the ear-bars in place, two sets of bite-bars, two anesthesia supply masks, and thru-holes and slots at each end of the base for positioning and fastening of the holder to the scanner.
The holder was designed to hold either two rats (150 – 450g) simultaneously, or a single rat in a scanner with a very small FOV. For dual rat scanning, our holder fits in small animal scanners with a minimum bore diameter of 220mm. This includes both the IndyPET-II (Rouze and Hutchins, 2003), an in-house scanner, and the microPET P4 (Tai et al, 2001), a scanner that is available commercially (Siemens, Knoxville, TN). In single rat mode, only half the holder is used so that it can fit inside a smaller bore machine, such as the Indiana Small Animal PET (ISAP) (Rouze et al., 2004; Rouze et al., 2005).
In the interest of maximizing image quality, the holder was designed to position two rat brains as near as possible to, and equidistant from, the CFOV. In order to do this, we used ear-bars that were made up of two parts: a tapered piece that locks the rat head in place and is then clamped to the holder, and a detachable handle that is initially needed to provide leverage during insertion, but which is otherwise not needed during the actual scan (Fig. 1). The detachable handle is removed before the holder is positioned in the scanner, so that the minimum distance between rat brains can be achieved.
Fig. 1.
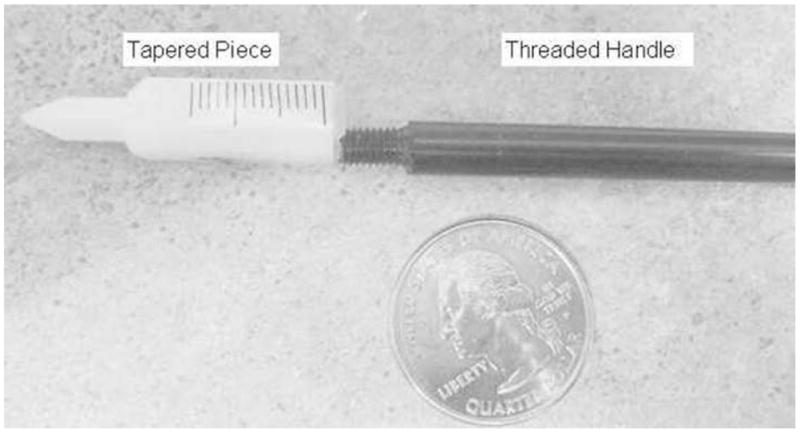
Disassembled ear-bars. The tapered piece is used for positioning and locking the rat head in place. The threaded handle provides leverage during ear bar insertion, but is taken off before placement of the holders in the scanner to minimize distance between rats.
On IndyPET-II, an aluminum optical rail and carrier with nine ¼-20″ threaded holes are fixed to a table in front of the scanner bore. Our holder was positioned with respect to this setup via a platform adaptor that was attached to the carrier. Stability and leveling of the holder in the IndyPET-II was provided by a support at the back of the scanner that was built to the same height as the carrier at the front. Eight ¼-20″ nylon thumb screws were used to attach the holder onto both the platform adaptor and the rear support through thru-holes and slots at the front and rear of the holder. On the microPET P4, a built-in animal bed was available. The holder was attached onto the microPET bed via two platform adaptors using bolts and nuts. On ISAP, the attachment mechanism was identical to that in IndyPET-II and microPET P4, except for the positioning of threaded holes in the adaptor platform. These were customized to hold half of the holder in parallel to the scanner axis.
Anesthesia was supplied to the rats through threaded holes in the anesthesia masks. A tube fitting (Swagelok, Solon, OH) was used to connect the cones to a small length of rubber tubing. At the other end of the rubber tubing, a plastic Quick-Connect adaptor (Swagelok, Solon, OH) fit into the inner diameter of the stretchable tubing extending from the anesthesia machine.
All parts were drawn and dimensioned with Pro/Engineer (PTC, Needham, MA) and machined using a combination of a 3-axis CNC mill (Hurco Companies Inc., Indianapolis, IN), a 13″ Swing Engine Lathe Sharp1340F (Sharp Machine Tools, Vancouver, Canada), a manual vertical knee mill (Chevalier Machinery, Santa Fe Spring, CA) and a Geared Head Drill (Clausing Industrial Inc, Kalamazoo, MI). Acrylic plastic was chosen as the holder material because it has a low linear attenuation coefficient, is inexpensive, machines well and is readily available. Acrylic was used for all of the pieces of the holder, except for the ear-bars, which were small and difficult to machine to specification. Ear-bars were instead machined from Polytetrafluoroethylene (PTFE) which produces a smoother finish, and is more easily machined, although it is denser than acrylic. Fig. 2 shows top views of layouts for the dual rat head holder as it would be situated in a) IndyPET-II and b) MicroPET P4. Main components of the holder are labeled.
Fig. 2.
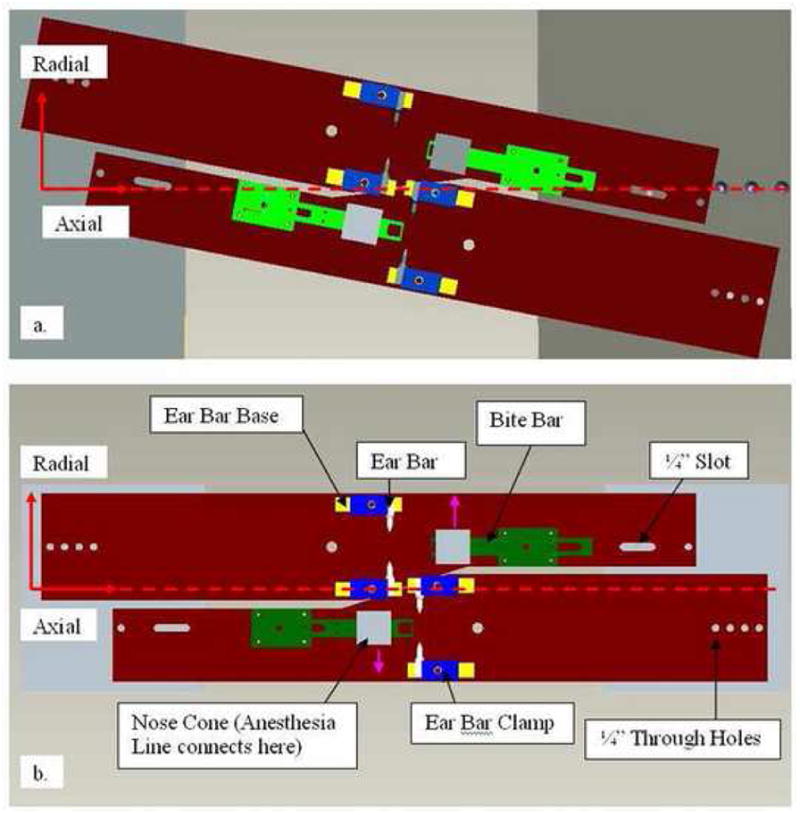
Layout of holder design in Pro/ENGINEER. a) Top view of dual rat configuration in IndyPET-II. b) Top view of configuration in microPET P4. The green structures are the bite-bars. The white, yellow and blue structures are the ear-bars, ear-bar supports and the clamps, respectively. Grey boxes are the anesthesia masks. Pink arrows on drawing (b) show exits from the masks to the anesthesia tubing. Horizontal dotted line indicates the main axis of the scanner bore.
2.2. Scanners
Experiments were performed on three small animal PET scanners: the IndyPET-II and ISAP, both built in-house in the Radiology department at the Indiana University School of Medicine, and a Siemens microPET P4, located at the Waisman Laboratory for Imaging at University of Wisconsin-Madison.
ISAP
Tangential, axial and radial resolutions are approximately 1.1 mm, 1.5 mm, and 1.1 mm respectively at CFOV. The FOV is 80 × 40 mm, with slice thickness of 0.87 mm (Rouze et al., 2004). The limited diameter of the scanner bore (10cm) contributes to its high (4%) sensitiivty (Rouze et al., 2005). But the dimensions of the ISAP can accommodate only one rat at a time on a single-rat holder.
IndyPET-II
Our 2nd generation small animal scanner has an axial sensitivity profile (in 3D mode) that is 9030 cps/MBq at the CFOV and drops linearly to 4250 cps/MBq at a radial distance of 100mm, measured using methods specified in the NEMA-2001 standards. Radial and tangential resolutions are both approximately 2.5 mm (FWHM) at CFOV. Resolutions increase gradually with radial distance from the CFOV to 4.5 mm and 2.8 mm respectively at 110mm radially from the CFOV. The total FOV is 230 mm diameter × 150 mm along the z-axis. Slice thickness is 3.15 mm (Rouze and Hutchins, 2003). Bore diameter is 250mm, and can accommodate two rats in our dual-rat head holder.
Micropet P4
MicroPET P4 has an axial sensitivity profile that is close to 12000 cps/MBq the CFOV and drops linearly to 1000 cps/MBq at 40 mm from CFOV, measured by stepping a point source along the axis of the scanner bore. Tangential, radial and axial resolutions increase from approximately 1.8 mm at CFOV to 2.55, 3.2 and 2.65 mm, respectively, at a radial offset of 55 mm. The FOV is 78 × 190 mm, with a bore diameter of 220 mm (Tai et al., 2001). The bore on the microPET P4 can also accommodate two rats positioned in the dual-rat head holder if positioned parallel to the major axis of the scanner (Fig. 2b).
2.3. Animal experiments
2.3.1. Positional Reproducibility
2.3.1.1. Protocol
ISAP was used to test for reproducibility of brain placement in the holder. One female Sprague Dawley (269.1±6.9g) was used. The rat was anesthetized with Isoflurane (induction at 5%, maintenance at 1–2%), weighed, and positioned in the head holder in single rat mode. Readings on ear (see Fig. 1) and bite bars were noted. A bolus of [11C]Raclopride (9.9±2.0 MBq) was injected manually via the tail vein, and dynamic 3D acquisition was performed for 60 minutes. The rat was scanned four times in separate scan sessions. The scans were spaced an average of 17.8±16 days apart.
2.3.1.2. Image Reconstruction
Scan data were acquired dynamically. However, for our purposes, summed static images from the first 75 minutes of the scans were used in data analysis. Normalization and dead time corrections were applied. Neither scatter nor attenuation corrections were applied.
2.3.1.3. Image Analysis
Static [11C]Raclopride images from the second, third and fourth scans (of the same animal) were aligned to that from the first scan, using the rigid body least square alignment via the “Realign” function (Friston et al., 1995) in SPM5 (http://www.fil.ion.ucl.ac.uk/spm/software/spm5/). Translation and rotation metrics from each of the alignments were recorded.
2.3.2. Effects of Attenuation and Scatter
2.3.2.1. Protocol
MicroPET P4 was used to determine scatter and attenuation effects when scanning in dual rat mode. Two male Sprague Dawley rats (425–434g) were each scanned in both single and dual modes. Rats were anesthetized with Isoflurane (induction at 5%, maintenance at 1–2.5%), weighed, and positioned in the rat holder. A transmission scan was performed with a rotating [57Co] source. A bolus of [18F]FDG (25.5 ± 0.74 MBq) was injected manually into the blood stream of each rat through a tail vein. The duration of bolus injection was approximately 1 minute. This was followed by 60 minutes of dynamic 3D emission acquisition. Each rat was scanned alone, positioned with its brain at CFOV, and also scanned another time with a partner in the dual rat holder. During dual rat scans, both rats in FOV were injected with [18F]FDG, one right after another (within 120 seconds). The heart rates of the rats were monitored with a Pulse Oximeter (Vet/Ox Plus 4700; SDI; Waukesha, WI) to assess the depth of anesthesia.
2.3.2.2. Image Reconstruction
Dynamic 3D images were reconstructed by Fourier rebinning followed by 2D filtered back projection using a Ramp filter (frames times: 10×30s, 5×60s, 10×150s, 1×300s and 2×600s). Images were reconstructed three times, once with scatter and attenuation correction using transmission scans, a second time without either scatter or attenuation correction, and a third time without scatter correction.
Using the transmission scan for a dual rat scan, a map of attenuation coefficients was generated for both the holder and the rats. This provided a comparison of the attenuation caused by various components of the holder and the rats.
2.3.2.3. Image Analysis
An elliptical, 3D ROI (width = 7 mm, height = 4 mm and depth = 16 mm) was drawn with MEDx (Medical Numerics, Inc,, Germantown, MD) to include the whole brain in each dynamic frame. TACs were extracted, decay corrected, and normalized for injected activity per body weight. The Patlak graphical analysis method (Patlak et al., 1983) was coded using Matlab (Mathworks, Natick, Massachusetts), and used to calculate the FDG uptake rate constant, Ki (sec−1), for all three reconstruction cases listed above: with scatter and attenuation correction, without either scatter or attenuation correction, and without scatter correction only. For an input function, we used an arterial plasma input curve acquired through blood sampling from the carotid artery of a rat in an earlier FDG experiment, which we normalized by injected activity per bodyweight. We designated this input function the “canonical” input curve. For linear fitting of the Patlak plot, cutoff was set at the tenth data point, corresponding to the first five minutes of each scan. TACs and Ki values from different cases were compared.
2.3.3. Kinetics of FDG Uptake in Single and Dual Modes
Both IndyPET-II and microPET P4 were used to compare kinetics of FDG uptake measured during dual mode scanning to those measured in single mode. For microPET P4, Ki values from TACs obtained from the methods described in the previous section (section 2.3.2) were used. For IndyPET-II, experimental protocols and image processing steps are described in the following sub-sections.
2.3.3.1. Protocol for IndyPET-II
In IndyPET-II, four female Sprague Dawleys (314–353g) were scanned in both modes using a similar protocol to that used in the microPET P4. However, in IndyPET-II, activity injected into each rat was 13.3 ± 2.2 MBq. Instead of manual injection, FDG was administered using an infusion pump (Harvard Apparatus, Holliston, Massachusetts). Each bolus injection lasted 2 minutes. During dual rat scans, the time lag between injections was 496 ± 329 seconds.
2.3.3.2. Image Reconstruction for IndyPET-II
Images acquired in 3D were binned into frames of 10×30s, 5×60s, 10×150s, 1×300s and 2×600s. 2D reconstruction was performed with filtered back projection, using a Hanning filter at 70% cutoff. Normalization and dead time corrections were applied. Attenuation and scatter correction were not available at the time.
2.3.3.3. Image Analysis for IndyPET-II
Images were analyzed using the same methods as those used for microPET P4 images. TACs and Ki from the single and dual scans in both IndyPET-II and microPET P4 were extracted, calculated and compared.
3. Results
3.1. Holder Design and Fabrication
The dual rat head holder was used in both IndyPET-II and microPET P4. In IndyPET-II, the holders were oriented obliquely to the main axis of the bore, so that brains could be positioned 60 mm radially and 8 mm axially away from each other. Distances between the thru-holes at one end and the slots at the other end were designed and machined such that when the holder was positioned in IndyPET-II via these mechanisms, each brain lay equidistant from the CFOV. The intent was to place each brain within 30.3 mm of the CFOV.
In microPET P4, because of the slightly smaller bore, the holders had to be placed parallel to the axis of the bore. Thus, the brains were each positioned slightly further from CFOV. Distances between brains were 70 mm radially and 20 mm axially. The intended distance of each brain from CFOV in the straight arrangement (Fig. 2b) was 36.4 mm.
The dual rat head holder can be disassembled into single paddles and used in single rat mode. For our purposes, rats scanned in single rat mode were positioned such that the brain was at the CFOV, and the holder base was oriented along the axis of the bore. The positioning mechanisms used in single mode are the same as in dual mode. The holder was used in both single and dual mode in IndyPET-II and microPET P4, and in single mode in ISAP. The holder is shown in use in each mode in Fig. 3.
Fig. 3.
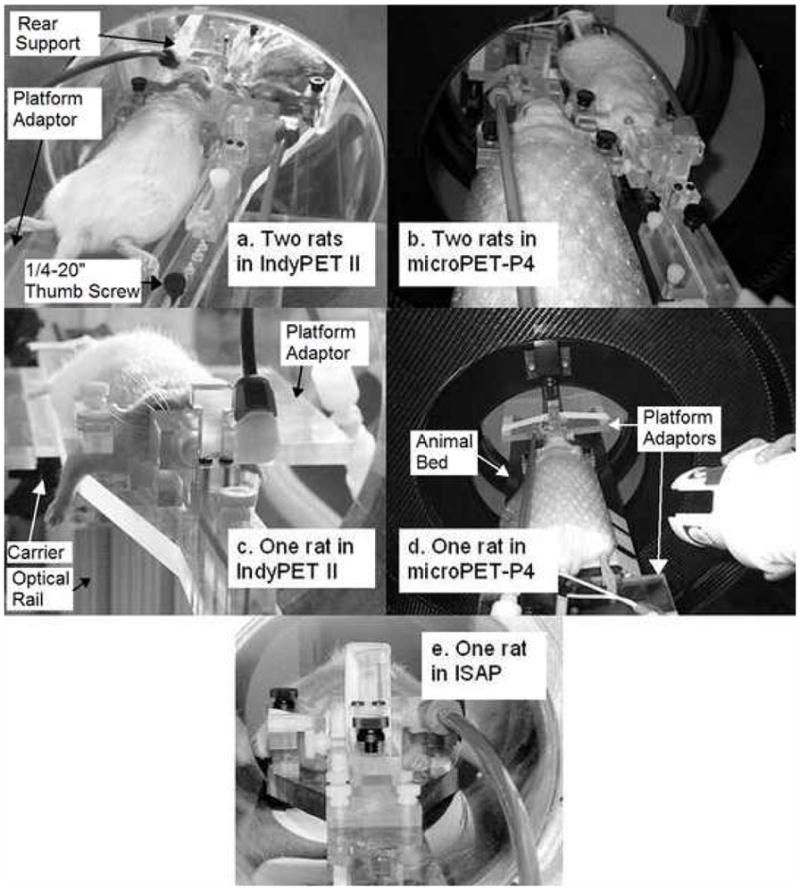
Holder in dual mode in a) IndyPET-II and b) microPET P4, and single mode in c) IndyPET-II, d) microPET P4 and e) ISAP.
An attenuation map of the holder obtained from the transmission scan of a dual rat scan in microPET P4 is shown in Fig. 4. Visually, attenuation by acrylic plastic appears to be similar to that of tissue (Fig. 4c). The ear bars, anesthesia tubing and tube fittings are of slightly higher density (see arrows in Figs 4b and 4c). ROIs were placed to extract the attenuation coefficients of various components in the image. Compared to the rat’s body, measured attenuation coefficients in the acrylic plastic are approximately 4% lower, while those for the ear bars, anesthesia tubing and the tube fittings are approximately 6%, 37% and 46% higher, respectively.
Fig. 4.
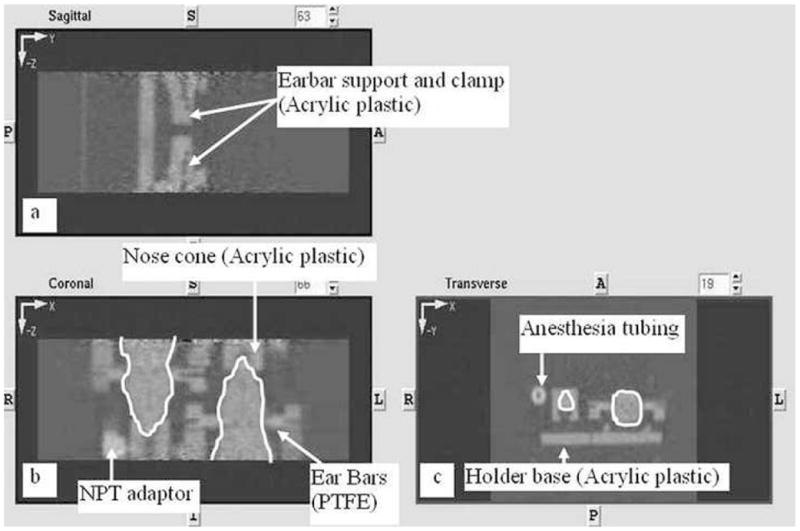
An attenuation map of holder in dual rat mode in a) sagittal, b) coronal and c) transverse views, calculated using a transmission scan on the microPET based on a [57Co] source. Only the middle length of the head holder is within the FOV, axially. The ear-bars and their support components, the nose cone, the anesthesia adaptor, part of the anesthesia tubing, and part of the bite-bars are visible and labeled. The outlines of the two rats are traced in white. The transverse view shows a cross section of a rat at the site of ear-bar insertions. Note that the rats are staggered along the length of the holder and only one set of ear-bars is visible in a single transverse view.
3.2. Animal Experiments
3.2.1. Positional Reproducibility
[11C]Raclopride binds specifically to dopamine (D2/D3) receptors, so striatal regions of the brain, which are rich in D2/D3 receptors, appear as hot spots in the [11C]Raclopride scans generated in ISAP. Visual comparison of Saggital, Axial and Coronal views from multiple scan sessions of the same rat in ISAP indicated that good positional reproducibility had been achieved with our holder. Fig. 5a shows an example of this comparison. No software alignment was performed. Fig. 5b shows the translational and rotational metrics obtained from alignment of the same rat scanned on different days.
Fig. 5.
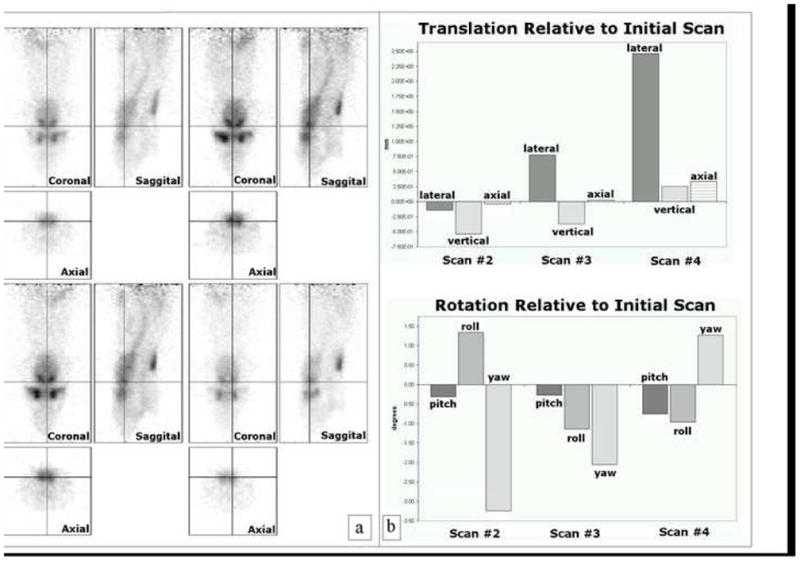
a) Visual comparison of the same rat scanned on different days. b) Translational and rotational metrics from alignment of from the same rat, scanned on different days using our [11C]Raclopride protocol, were obtained using SPM 5.
3.2.2. Brain Positioning in Dual Rat Scans
Fig. 6 shows coronal views of reconstructed dual rat scans in microPET P4 and IndyPET-II. In IndyPET-II, inter-brain distances were shorter than in microPET P4. Because the holder was always positioned symmetrically about the CFOV, the net distances from each brain to CFOV were also shorter in IndyPET-II than in microPET P4. Table I shows measured distances versus intended distances based on the design.
Fig. 6.

Reconstructed images of dual rat scans in a) microPET P4 and b) IndyPET-II,. Elliptical ROIs are drawn to encompass the whole brain. Distance and angle offsets between each brain were calculated by drawing lines to connect the center of each ROI.
Table I.
Measured distance of brain to CFOV in an actual experiment versus design intent in IndyPET-II (2nd and 3rd columns) and microPET P4 (4th and 5th columns).
| IndyPET-II | microPET P4 | |||
|---|---|---|---|---|
| Design Intent (mm) | Actual measurement (mm) | Design Intent (mm) | Actual measurement (mm) | |
| Radial distance from each brain to CFOV | 30 | 34 | 35 | 37 |
| Axial distance from each brain to CFOV | 4 | 5 | 10 | 15 |
| Total Distance | 30.3 | 34.4 | 36.4 | 40 |
Dual rat scans required each rat to be placed away from the CFOV, where resolution and signal sensitivity are optimal. Table I shows that the rat brains in a dual rat scan in IndyPET-II were positioned 34 mm radially and 5 mm axially from CFOV. Based on the idealized scanner characteristics (Rouze and Hutchins, 2003), we would expect a degradation of at least 9% and 4% in radial and tangential resolution respectively, and a drop in sensitivity by at least 3%. Rats in a dual rat scan in microPET P4 were positioned 37 mm radially and 15 mm tangentially from CFOV. We would expect the corresponding degradation in sensitivity to be a minimum of 42%. The degradation in radial, tangential and axial resolutions that we would expect based on published specifications, based on radial offset, would be at least 66%, 33% and 44% respectively (Tai et al., 2004).
Fig. 7 shows transaxial slices of the same rat in single (fig. 7a) and dual (fig. 7b) mode. To demonstrate compromised resolution for the dual scans, a small gland behind the brain, shown in fig. 7, was chosen. Lines drawn through this gland gave us scaled line profiles, displayed below the images. The sharper peaks from the profile for the single scan, versus the more blunted peaks for the dual scan, indicate compromised resolution for the dual scan, resulting from the rat brains being placed away from the CFOV. This observation is consistent with published data for microPET P4 (Tai et al., 2004), and is especially pronounced for the two smaller peaks that represent uptake of the surface tissue.
Fig. 7.
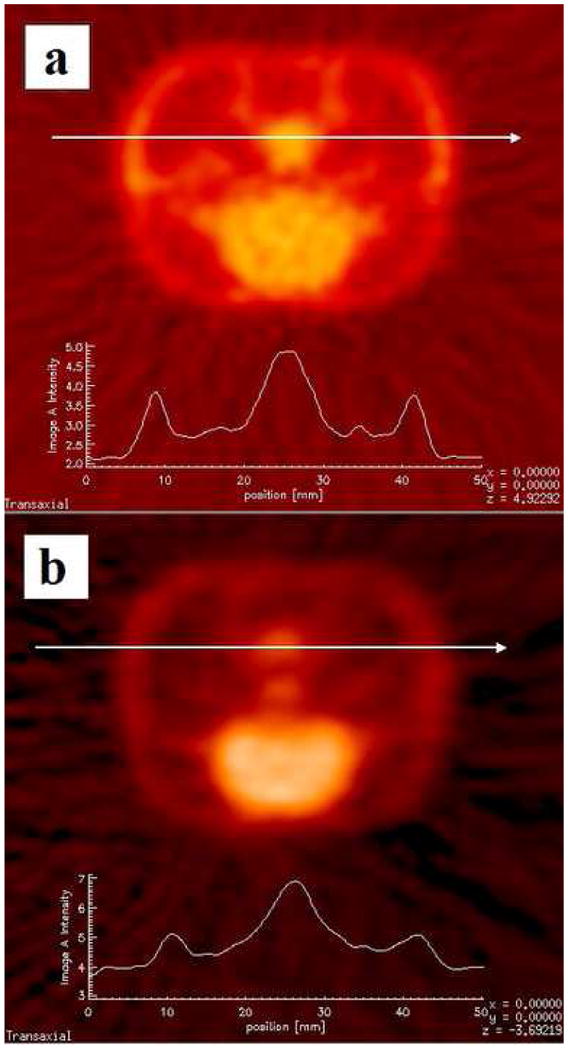
Slices from reconstructed images of the same rat scanned in microPET P4, once in a) single mode, and once in b) dual mode. A line was drawn through identical structures in both scans to obtain scaled line profiles. The line profile from the single scan (a) shows sharper peaks compared to the profiles from the dual scan (b). This is consistent with our expectation that image resolution is compromised in the dual scan, where the brain is positioned away from the CFOV.
3.2.3. Effects of Attenuation and Scatter
Examples of TACs extracted from images of a dual and single scan are shown in Fig. 8. As we would expect, comparing the corrected and uncorrected TACs, attenuation correction increased scale of the TACs, while scatter correction decreased it. Scatter correction had considerably less effect on the scale of the TACs compared to attenuation correction.
Fig. 8.
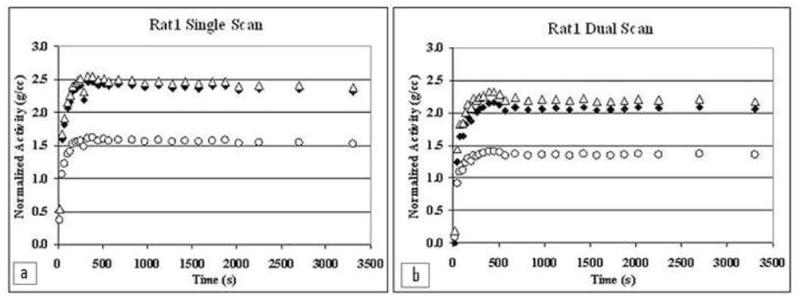
Whole brain FDG TACs extracted from scans of Rat 1, comparing different types of corrections. a) shows TACs from the single rat scan, and b) shows TACs from a dual rat scan of the same animal. Open circles depict TACs reconstructed with neither attenuation nor scatter corrections. Open triangles are TACs with attenuation correction but without scatter corrections. Solid diamonds depict TACs with both attenuation and scatter corrections.
Table II shows the relative scales of the different TACs based on an average point-by-point comparison of the curves. The data indicate that scatter in dual mode (with approximately 25.9 MBq in each rat) is approximately twice the amount of scatter in the single mode. Attenuation is only slightly higher in dual versus single scans (9%). Taking single and dual scans together, the average effect of scatter is to increase Ki by 6.8 ± 2.3%.
Table II.
Comparison of TAC scale with and without attenuation and scatter corrections on microPET P4. Data in this table were calculated as follows: effect of attenuation on the TAC for Rat 1 in dual mode (−63.2%) is based on the percentage change from the attenuation corrected TAC (open triangles) to the uncorrected TAC (open circles) in Fig. 9(b). The effect of scatter on the TAC for Rat 1 in dual mode (12.2%) is based on the percentage change from the attenuation corrected TAC (open triangles) to the attenuation and scatter corrected TAC (filled diamonds) in Fig. 9(b). Both scatter and attenuation effects are relative to the uncorrected curve (open triangles).
| Effect of Scatter on scale (%) | Effect of Attenuation on scale (%) | |
|---|---|---|
| Rat 1 Dual | 12.2 | −63.2 |
| Rat 2 Dual | 12.4 | −61.0 |
| Rat 1 Single | 5.4 | −57.4 |
| Rat 2 Single | 6.9 | −56.6 |
3.2.4. Kinetics of FDG Uptake during Single and Dual Rat Scans
For FDG studies, examples of TACs and Patlak plots from single and dual scans are shown in Fig. 9. In the single rat mode, the rats scanned were in the optimal position at the CFOV. In the dual rat mode, the rats were positioned away from the CFOV.
Fig. 9.
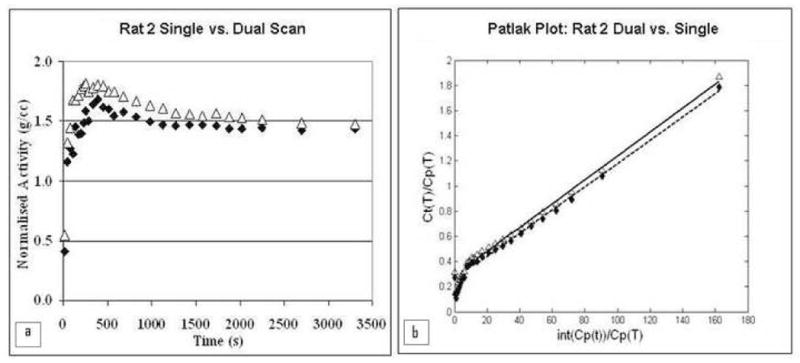
Example of a) TACs and b) Patlak plots for Rat 2. Solid data points represent data from the single rat scan. Open data points are from the dual rat scan.
The percentage differences in Ki between single and dual rat scans are shown in Table III for both IndyPET-II and microPET P4 and all reconstruction corrections applied to microPET P4 data. Comparing dual to single scans, the percentage difference in Ki is 6.3 ± 7.5% (not tested for standard normal distribution). There was no discernable trend for Ki in single versus dual scans. Rat 6, which was partnered with rat 5, had to be excluded from the comparative analysis due to a corrupted single-rat scan. A paired student t-test was performed to compare Ki from single and dual scans. Ki values from the single and dual scans were not significantly different (p = 0.68).
Table III.
Percent difference in Ki due to single versus dual mode for each rat. Non-shaded values in the right most column reflect average effects of scan mode. Shaded results show additional comparisons of dual versus single in microPET P4 without one or more corrections but are not included in the global average because they are from the same rats in rows 1 and 2.
| Rat | Attenuation & Scatter Correction | Scanner | Ki Single (sec−1) | Ki Dual (sec−1) | Effect of Scan Mode (%) |
|---|---|---|---|---|---|
| 1 | all | microPET-P4 | 0.0155 | 0.0140 | 9.7 |
| 2 | all | microPET-P4 | 0.0092 | 0.0095 | −3.3 |
| 1 | attenuation only | microPET-P4 | 0.0158 | 0.0146 | 7.6 |
| 2 | attenuation only | microPET-P4 | 0.0095 | 0.0101 | −6.3 |
| 1 | none | microPET-P4 | 0.0102 | 0.0090 | 11.8 |
| 2 | none | microPET-P4 | 0.0062 | 0.0063 | −1.6 |
| 3 | none | IndyPET-II | 0.0074 | 0.0064 | 13.5 |
| 4 | none | IndyPET-II | 0.0077 | 0.0068 | 11.7 |
| 5 | none | IndyPET-II | 0.0080 | 0.0080 | 0.0 |
| 6 | none | IndyPET-II | - | 0.0071 | - |
| Average | 6.3 | ||||
| StDEV | 7.5 | ||||
4. Discussion
4.1. Effect of dual versus single mode scanning
We tested our rat head holder in two different scanners with and without attenuation and scatter corrections and compared its use in dual and single modes. In dual mode, the presence of the second animal contributes negligibly to the estimate of FDG uptake constant in either animal. This finding was insensitive to scanner or to the application of scatter and/or attenuation correction.
4.2. Experimental Procedures using the Dual Rat Head Holder
For experienced users, ear-bar insertion typically takes less than a minute. For that short period of time, the rat can be taken off anesthesia. But, speed is crucial to prevent the rat from waking up during the placement. For inexperienced users, a minute is inadequate for successful rat positioning. Depending on the rat and the amount of anesthesia given prior to placement, the rat could wake up in as little as twenty seconds, especially when disturbed by a foreign object in the ear canal. If there were a need to redo the placement, the rat would have to be anesthetized again. In the initial design of our holder, there was no way to maintain anesthesia while positioning the rats in the ear-bars. To allow for concurrent anesthesia and ear-bar positioning, we had to make the entire bite-bar removable (See Fig. 10). This important modification allows anesthesia to be supplied to the rat via nose cone during ear-bar insertion, and to afford the investigator greater maneuverability. Once ear bar placement is completed, the bite bar is re-attached to the palette (i.e., the base of the holder). We found that this setup enabled new graduate students to acquire the necessary expertise to place rats in the holder without the need for extensive prior practice.
Fig. 10.
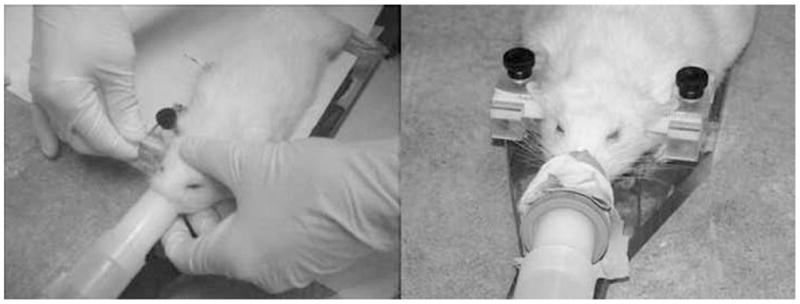
Keeping a rat under anesthesia while inserting ear bars. Detachable bite bar assembly was removed to improve maneuverability while inserting earbars, and to enable direct connection of the anesthesia line to the rat via a nose cone.
Anesthesia administration during dual scan mode was challenging because the needs of individual rats for isoflurane differed according to body weight and individual biology. Initial experiments with a branched adaptor with valves on each branch to supply two rats from one anesthesia machine proved impractical and frustrating. The valves did not allow sufficiently precise differential control of air and anesthesia flow in each branch to keep both rats anesthetized safely. The weight of the metallic valve also restricted motion of the holder and the rats when they had to be moved together into the scanner. Using two anesthesia machines was necessary to provide sufficient control over the amount of isoflurane delivered to each rat. An alternative solution would be to use a branched adaptor with a lightweight valve and precise flow meter on each branch.
The positional reproducibility of the holder was tested in the single rat mode in ISAP, and not in the dual rat mode. The bore size of ISAP restricts scans to only one rat at a time. However, placement mechanisms in single rat mode are identical to those of dual rat mode. Therefore, testing for positional reproducibility on ISAP was sufficient for validation purposes. We found the repositioning ability of our holder to be quite good. Figure 5 shows images of a rat scanned in ISAP on four separate occasions. The fourth scan (bottom right image) in Figure 5 appears to be shifted (by 2.5 mm; see plot of x-translation in Fig 5b) to the left relative to the common cross-hairs. A review of our lab notebooks indicated that we had not positioned the ear bars in accordance with the recordings we had made in earlier scans. This oversight accounts quite well for the observed shift.
As brains are positioned further from the CFOV, the spatial resolution will degrade – as documented in fig. 7. As the resolution degrades (FWHM increases with position), small objects (defined as smaller than 2.5 times the FWHM) will incur increasing partial volume error (Kessler et al., 1984).
For the comparison of dual vs. single scans, evaluation of FDG kinetics was performed using whole-brain ROIs. If smaller target regions such as the striatum were of interest, scanning the brains away from the CFOV could degrade the accuracy of the modeled kinetic parameters due to the loss of resolution and sensitivity.. Further evaluation of dual vs. single scans on smaller target regions could be interesting and worthwhile.
We used a single canonical input function to calculate Ki for all rats, operating under the assumption that blood flow and injection rates did not differ appreciably between rats. This was not ideal. In addition, in IndyPET-II, the injections were controlled by a programmable pump, but in microPET P4, the injections were done manually. This may have introduced variability into our results. Work by other groups suggests that the rat heart could be used to acquire an input function (Fang and Muzic, 2007), provided that it is captured in the images. One way to overcome the disadvantages of using a canonical input function would be to make use of such methods. However, we would need to rethink our holder positioning to guarantee that the heart would always be in the FOV, which is not the case presently.
A fourth pair of animals was examined in single and dual mode on the microPET, but the data from this experiment were not included in our analysis. The kinetics of uptake of FDG in the brains of both rats in dual mode were atypical. The curves (not shown) continued to rise at 60 minutes, unlike all other FDG TACs obtained. We completed additional scans with those animals, and concluded that the nonsaturating uptake of FDG in both animals during the scan with nonstandard TACs was attributable to unintended fasting of the animals. We note that scatter correction and attenuation correction had the same relative effects and roughly the same magnitudes of effect on the abnormal scans as were observed with all other scans.
4.3. Further Design Recommendations
If attenuation corrections are unavailable on the primary scanner of use, materials that have a lower attenuation coefficient than acrylic plastics such as C-552 Air equivalent plastics, mylar or polyethylene may be preferred. However, these materials are harder to obtain, cost more, and in some cases, are harder to machine.
Administration of drugs through an in-dwelling catheter is a procedure we would like to be able to perform routinely during small animal scanning. The existing holder design can accommodate use of catheterized animals. If lead shielding is required on the torso of the rat to reduce scatter and dead time errors in brain imaging studies, our holder could be used without significant modification.
5. Conclusions
Kinetic data derived from scanning two rats simultaneously are comparable to those derived from scans of individual rats. The difference in Ki caused by dual scanning as opposed to single scanning is not statistically significant. Dual rat scanning in a semi-stereotaxic holder is practical for economical small animal scanning and does not compromise kinetic accuracy of [18F]FDG dynamic scan data.
Acknowledgments
The authors wish to thank Brian McCarthy for help with PET scanning, Larry Corbin and Joe Huerkamp for help with machining and Wendy Winkle and Dr. Gary Hutchins for their help in administering the Indiana Center of Excellence in Biomedical Imaging. This work was funded in part by NIH grants R21 AA015077 (to EDM), P60 AA007611-16 (to the Indiana Alcohol Research Center) and Indiana Genomics Initiative (INGEN, supported in part by the Lilly Endowment, Inc.)
Footnotes
Publisher's Disclaimer: This is a PDF file of an unedited manuscript that has been accepted for publication. As a service to our customers we are providing this early version of the manuscript. The manuscript will undergo copyediting, typesetting, and review of the resulting proof before it is published in its final citable form. Please note that during the production process errors may be discovered which could affect the content, and all legal disclaimers that apply to the journal pertain.
References
- 1.Cherry SR, Shao Y, Silverman RW, Meadors K, Siegel S, Chatziioannou A, Young JW, Jones W, Moyers JC, Newport D, Boutefnouchet A, Farquhar TH, Andreaco M, Paulus MJ, Binkley DM, Nutt R, Phelps ME. MicroPET: A high resolution animal PET scanner for imaging small animals. IEEE Trans Nucl Sci. 1997;44:1161–1166. [Google Scholar]
- 2.Fang YH, Muzic RF. Estimating Input Functions from Images for FDG-PET Small Animal Imaging without Blood Sampling. Joint Molecular Imaging Conference. 2007; Providence; Rhode Island, USA. [Google Scholar]
- 3.Fricke ST, Vink R, Chiodo C, Cernak I, Ileva L, Faden AI. Consistent and reproducible slice selection in rodent brain using a novel stereotaxic device for MRI. Journal of Neuroscience Methods. 2004;136:99–102. doi: 10.1016/j.jneumeth.2004.01.003. [DOI] [PubMed] [Google Scholar]
- 4.Friston KJ, Ashburner J, Frith CD, Poline JB, Heather JD, Frackowiak RSJ. Spatial registration and normalization of images. Human Brain Mapping. 1995;2:165–189. [Google Scholar]
- 5.Hume SP, Myers R. Dedicated Small Animal Scanners: A New Tool for Drug Development? Current Pharmaceutical Design. 2002;8:1497–1511. doi: 10.2174/1381612023394412. [DOI] [PubMed] [Google Scholar]
- 6.Jeavons AP, Dettmar CAR, Chandler RA. A 3D HIDAC-PET camera with sub-millimetre resolution for imaging small animals. IEEE Trans Nucl Sci. 1999;46:468–873. [Google Scholar]
- 7.Kessler RM, Ellis JR, Jr, Eden M. Analysis of emission tomographic scan data: limitations imposed by resolution and background. J Comput Assist Tomogr. 1984 Jun;8(3):514–22. doi: 10.1097/00004728-198406000-00028. [DOI] [PubMed] [Google Scholar]
- 8.Lecomte R, Cadorette J, Richard P, Rodrigue S, Rouleau D. Design and Engineering aspects of a high resolution positron tomograph for small animal imaging. IEEE Trans Nucl Sci. 1994;41:1446–1452. [Google Scholar]
- 9.Ralph Myers, Hume SP. Small animal PET. European Neuropsychopharmacology. 2002;12(6):545–555. doi: 10.1016/s0924-977x(02)00103-7. [DOI] [PubMed] [Google Scholar]
- 10.Patlak CS, Blasberg RG, Fenstermacher JD. Graphical Evaluation of Blood-to-Brain Transfer Constants from Multiple-Time Uptake Data. Journal of Cerebral Blood Flow and Metabolism. 1983;3:1–7. doi: 10.1038/jcbfm.1983.1. [DOI] [PubMed] [Google Scholar]
- 11.Rouze NC, Hutchins GD. Design and Characterization of IndyPET-II: A High Resolution, High Sensitivity Dedicated Research Scanner. IEEE Transaction on Nuclear Science. 2003;50(5):1491–1497. [Google Scholar]
- 12.Rouze NC, Schmand M, Siegel S, Hutchins GD. Design of a Small Animal PET Imaging System with 1 Microliter Volume Resolution. IEEE Transaction on Nuclear Science. 2004;51(3):757–763. [Google Scholar]
- 13.Rouze NC, Soon V, Young J, Siegel S, Hutchins GD. Initial evaluation of the Indiana small animal PET scanner. Nuclear Science Symposium Conference Record. 2005;4:2394–2398. [Google Scholar]
- 14.Rubins DJ, Meadors AK, Yee S, Melega YP, Cherry SR. Evaluation of a stereotactic frame for repositioning of the rat brain in serial positron emission tomography imaging studies. Journal of Neuroscience Methods. 2001;17:63–70. doi: 10.1016/s0165-0270(01)00352-1. [DOI] [PubMed] [Google Scholar]
- 15.Tsuyoshi Tada, Wendland M, Watson N, Kuriyama N, Kuriyama H, Roberts T, Burns M, Weiss W, Israel MA. A head holder for magnetic resonance imaging that allows the stereotaxic alignment of spontaneously occuring intracrarnial mouse tumors. Journal of Neuroscience Methods. 2002;116:1–7. doi: 10.1016/s0165-0270(02)00014-6. [DOI] [PubMed] [Google Scholar]
- 16.Tai YC, Chatziiannou A, Siegel S, Young J, Newport D, Goble RN, Nutt RE, Cherry SR. Performance Evaluation of the microPET P4: a PET system dedicated to animal imaging. Physics in Medicine and Biology. 2001;46:1845–1862. doi: 10.1088/0031-9155/46/7/308. [DOI] [PubMed] [Google Scholar]


