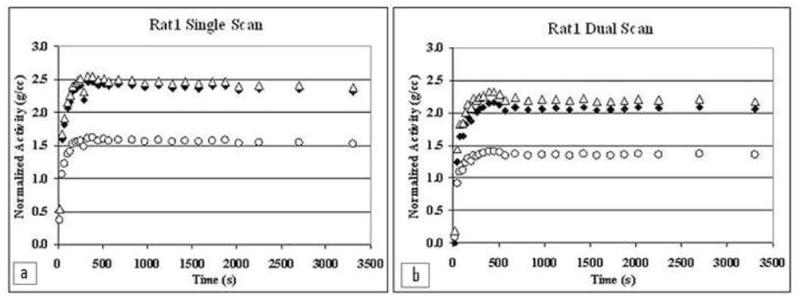
Fig. 8.

Whole brain FDG TACs extracted from scans of Rat 1, comparing different types of corrections. a) shows TACs from the single rat scan, and b) shows TACs from a dual rat scan of the same animal. Open circles depict TACs reconstructed with neither attenuation nor scatter corrections. Open triangles are TACs with attenuation correction but without scatter corrections. Solid diamonds depict TACs with both attenuation and scatter corrections.
