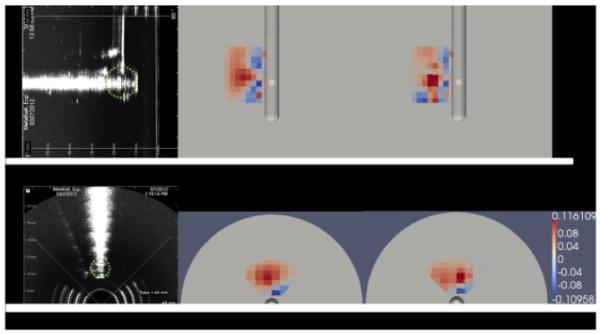
Fig. 7.

Ultrasound images and electrical property reconstruction images of imaging a metal ball inclusion. (a) Sagittal cross section of the ultrasound image. A green dotted circle is imposed on the ultrasound image to represent the size and location of the inclusion (same in (d)). (b) The sagittal cross section of the conductivity reconstruction using only 30 probe electrodes. (c) The sagittal cross section of th e conductivity reconstruction using 30 probe electrodes and 3 additional needle electrodes. (d) The transverse cross section of the ultrasound image. (e) The transverse cross section of the conductivity reconstruction using only 30 probe electrodes. (f) Tr ansverse cross section of the conductivity reconstruction using 30 probe electrodes and 3 additional needle electrodes. The color map of reconstructed values is in S/m.
