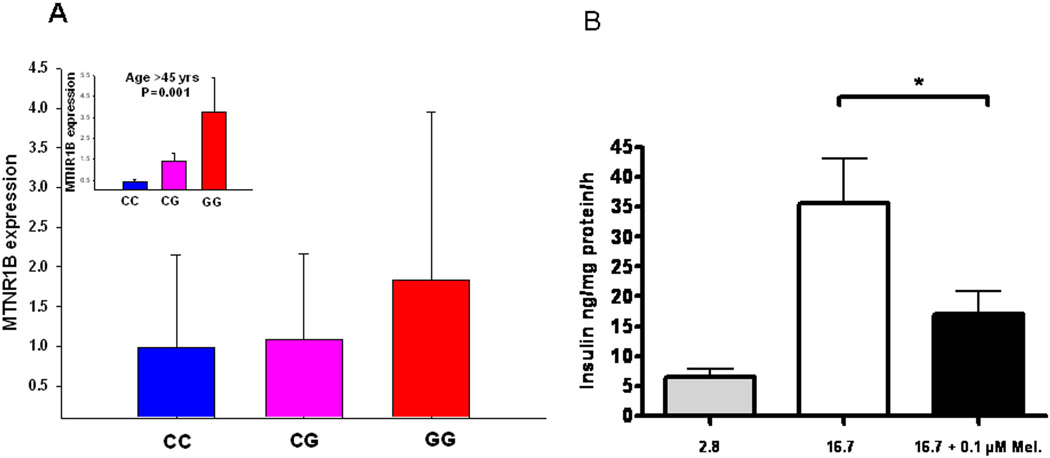
Figure 3. Expression of MTNR1B in human pancreatic islets.
(A) The MTNR1B mRNA levels were higher in risk GG genotype carriers (total n=51, CC=21, CG=25, GG=5; non-adjusted P=0.25, age-adjusted P=0.01). The insert graph shows expression of the MTNR1B mRNA levels in the individuals above mean age of 45 years (total n=25, CC=10, CG=13, GG=2; P=0.001): The MTNR1B mRNA levels were higher in risk GG genotype carriers. (B) Insulin secretion in INS-1 832/13 clonal β-cells in response to stimulation with 2.8 mM (grey bar) and 16.7 mM glucose (white bar) in with the presence and absence of 0.1µM melatonin (black bar). Individual experiments were performed in triplicate (n = 7, * p < 0.037). Bars represent mean ± SEM.

