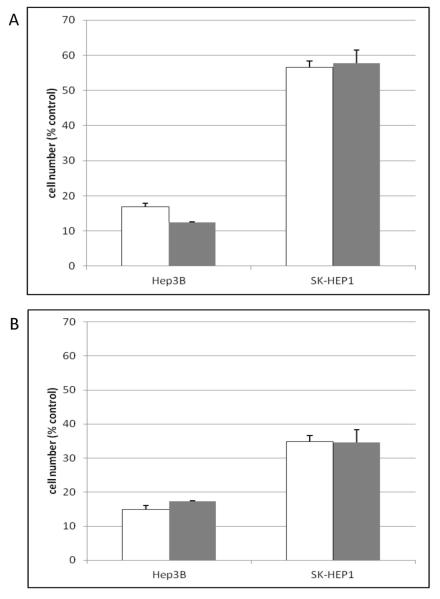
Figure 1.
Effect of treatment time and cell numbers on sensitivity of HCC cell lines to wnt pathway inhibition
Hep3B or SK-Hep1 cells were plated in 384-well tissue culture treated plates at 1000 or 2000 cells per well. After overnight attachment, the wnt pathway inhibitor, A606, was added (10 μM final concentration). Following 2d (panel A) or 3d (panel B) incubation, cell numbers were assessed using the XTT assay and normalized to untreated controls wells.
Open bars: 1000 cells/well, gray bars: 2000 cells/well. Error bars represent standard deviation (n = 3 plates, duplicate wells per plate).

