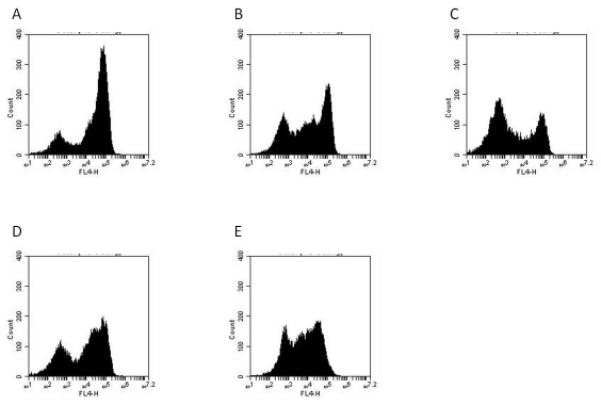
Figure 2.

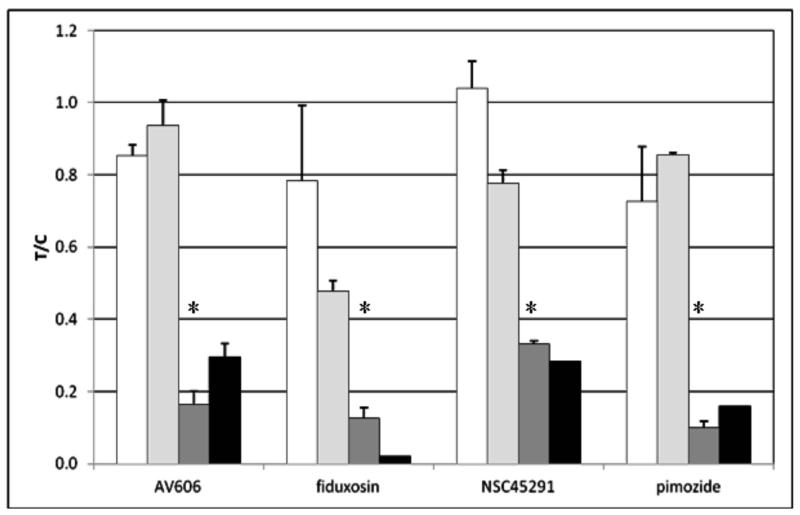
Effect of active compounds on EpCAM expression in Hep3B cells.
Cells were treated for 1-2 d with the indicated compound followed by harvesting as assessment of EpCAM expression by flow cytometry using APC-labeled anti-EpCAM (clone EBA-1).
A: untreated, B: AV606 (1 μM, 2 d), C: fiduxosin (10 μM, 2 d), D: NSC45291(10 μM, 2 d), E: pimozide (10 μM, 2 d).
“FL4-H” = fluorescence intensity (APC channel).
In panel F, data from flow cytometry experiments were analyzed for % of cells expressing any EpCAM and for median expression of EpCAM in the cell population. All results were normalized to the value for control (untreated) cells and presented at treated/control ratio (T/C).
Error bars represent sd or range (n = 2-4).
Open bars: total EpCAM-positive cells, 1 d incubation with compounds
Light gray bars: total EpCAM-positive cells, 2 d incubation with compounds
Dark gray bars: median EpCAM expression, 1 d incubation with compounds
Black bars: median EpCAM expression, 2 d incubation with compounds.
*p < 0.05, students t-test. For 2 d, data are insufficient for t-test analysis.

