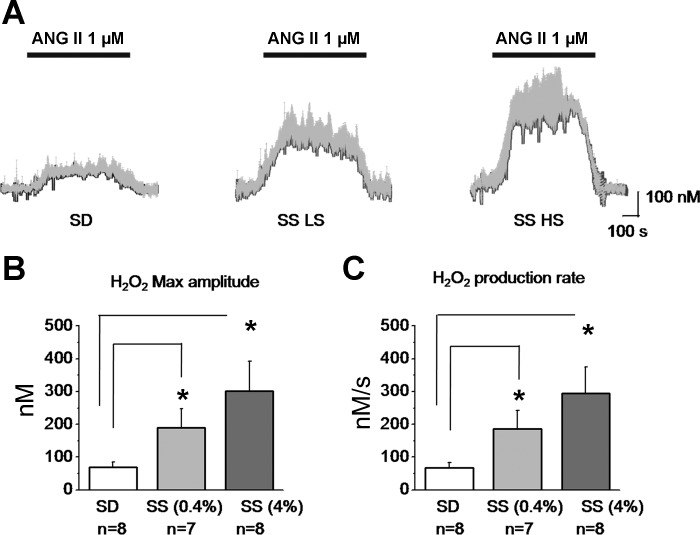
Fig. 5.
ANG II perfusion causes H2O2 release in the rat kidney cortex. A: real-time changes of the mean H2O2 (gray bars show SE) from total n = 8 applications (4 kidneys from 4 different rats). Bars on the top represent ANG II (1 μM) application. B: maximal H2O2 concentration amplitude values during ANG II perfusion for SD and SS rats fed a low- and a high-salt diet, respectively. C: H2O2 production rates calculated as integral over time during the active release (phase different from 0). *P < 0.05 vs. SD rats.

