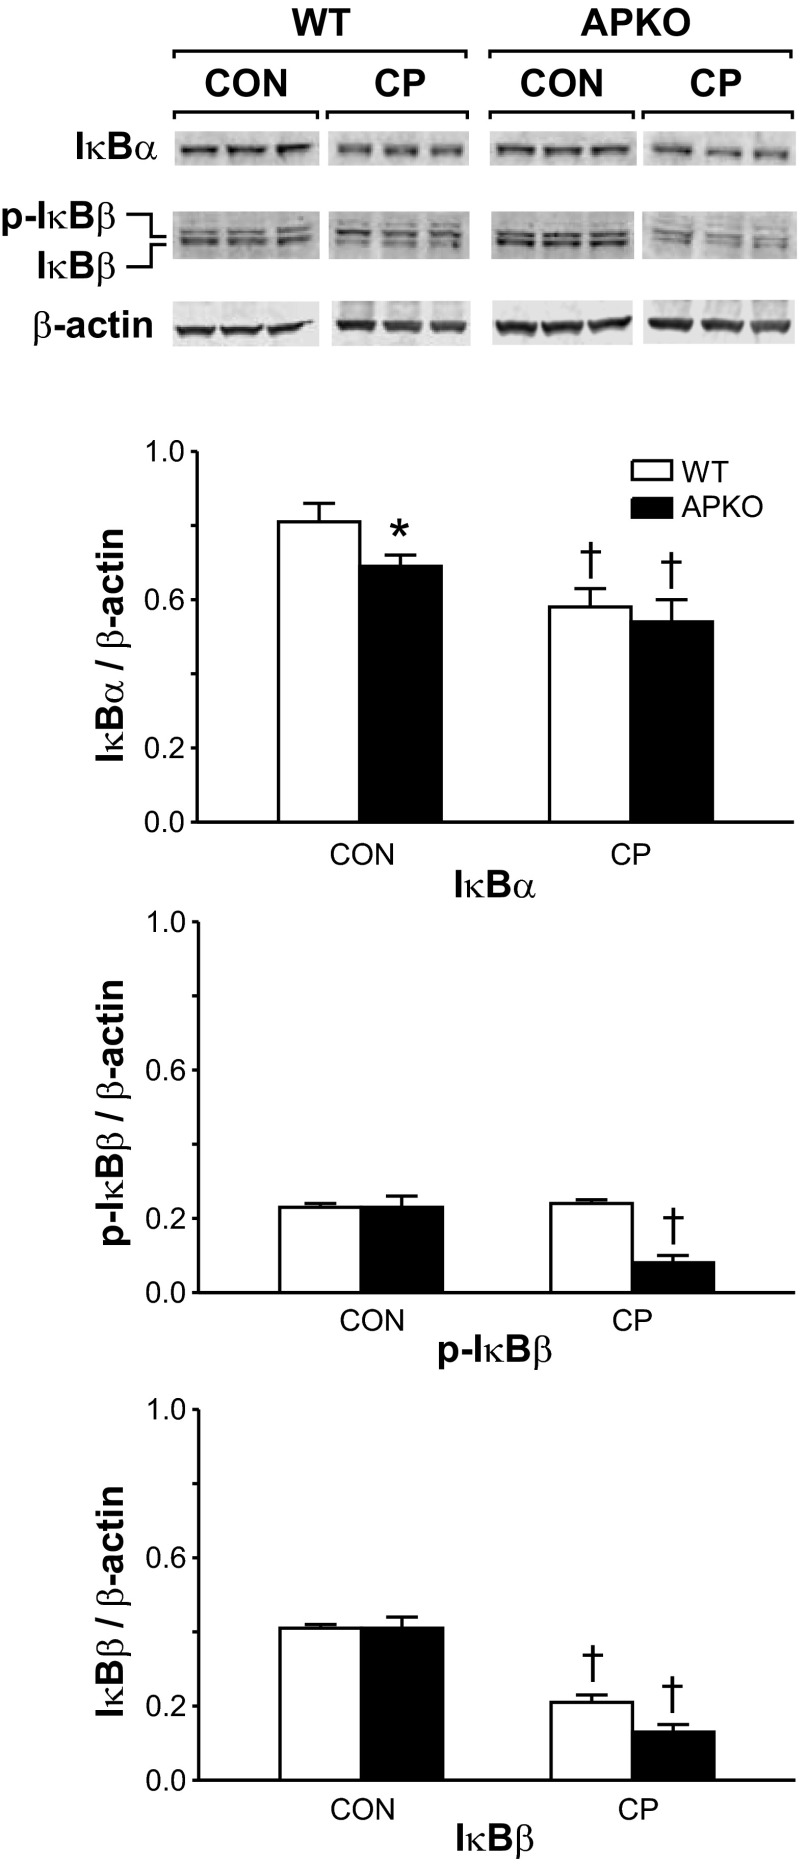
Fig. 9.
Top: Western blots of pancreatic IκBα and IκBβ protein levels in WT and APKO mice with CP. Pancreata were harvested prior to (CON) and following (CP) the final series of cerulein injections for Western blot analyses. Cerulein injections were given for 3 wk. Bottom: IκBα and IκBβ band intensities. Densitometric values are means ± SE; n = 6 mice per group. p-IκBβ, phosphorylated IκBβ. *P < 0.05 vs. WT. †P < 0.05 vs. corresponding CON value.

