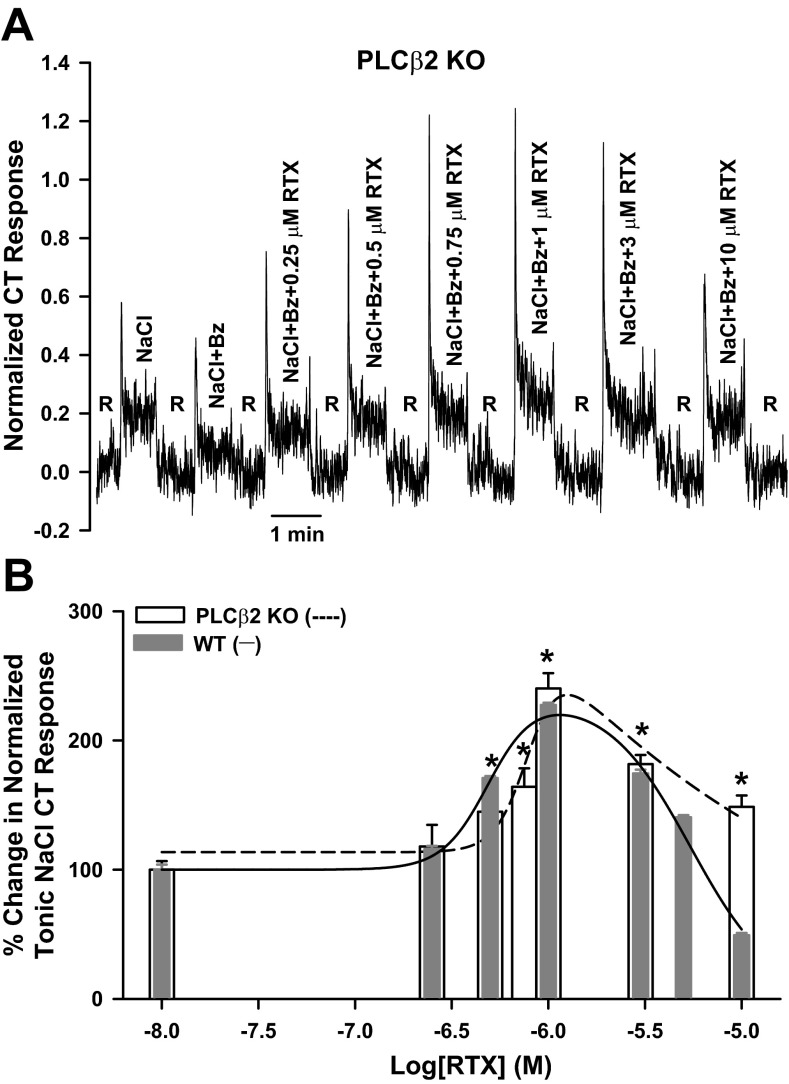
Fig. 8.
Effect of RTX on the NaCl + Bz CT response in PLCβ2 KO mice. A: representative normalized CT response to lingual stimulation first with a rinse solution (R; 10 mM KCl) and then with 100 mM NaCl + 5 μM Bz and 100 mM NaCl + 5 μM Bz + RTX (0.25–10 μM) in a PLCβ2 KO mouse. B: Bz-insensitive NaCl CT responses in each PLCβ2 KO mouse normalized to the corresponding CT responses obtained with 300 mM NH4Cl. Values are means ± SE of 3 animals. *P = 0.0193, 0.0153, 0.0005, 0.0011, and 0.0115 for 0.5, 0.75, 1, 3, and 10 μM RTX, respectively, relative to NaCl + Bz alone (paired). Data points for the WT mice in Fig. 7A (solid line) are plotted for easy comparison.

