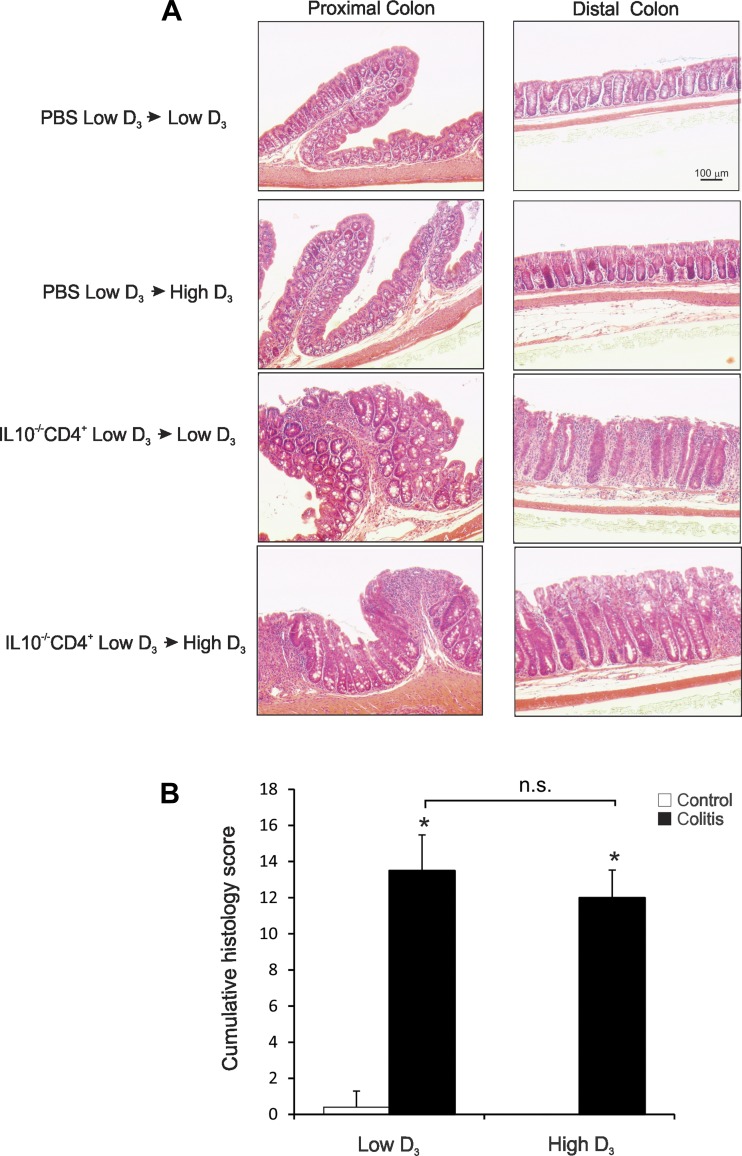
Fig. 2.
Histology of the proximal and distal colon of control and IL-10−/− CD4+ T cell-transferred mice maintained on the low vitamin D3 diet or switched to the high vitamin D3 diet. A: histological analysis (hematoxylin-eosin staining) of colon morphology in control and T cell-transferred mice on the low or high vitamin D3 diet. Scale bar applies to all images. B: cumulative histology score for the proximal and distal colon, on a scale of 0–5 based on the degree of lamina propria mononuclear cell infiltration, crypt hyperplasia, and architectural distortion, by an unbiased pathologist according to previously described criteria (24). Values are means ± SE; n = 5 and 7 for control and colitis groups, respectively. *P ≤ 0.05 vs. control [by ANOVA followed by Fisher's protected least significant difference (PLSD) post hoc test]; ns, not significant.

