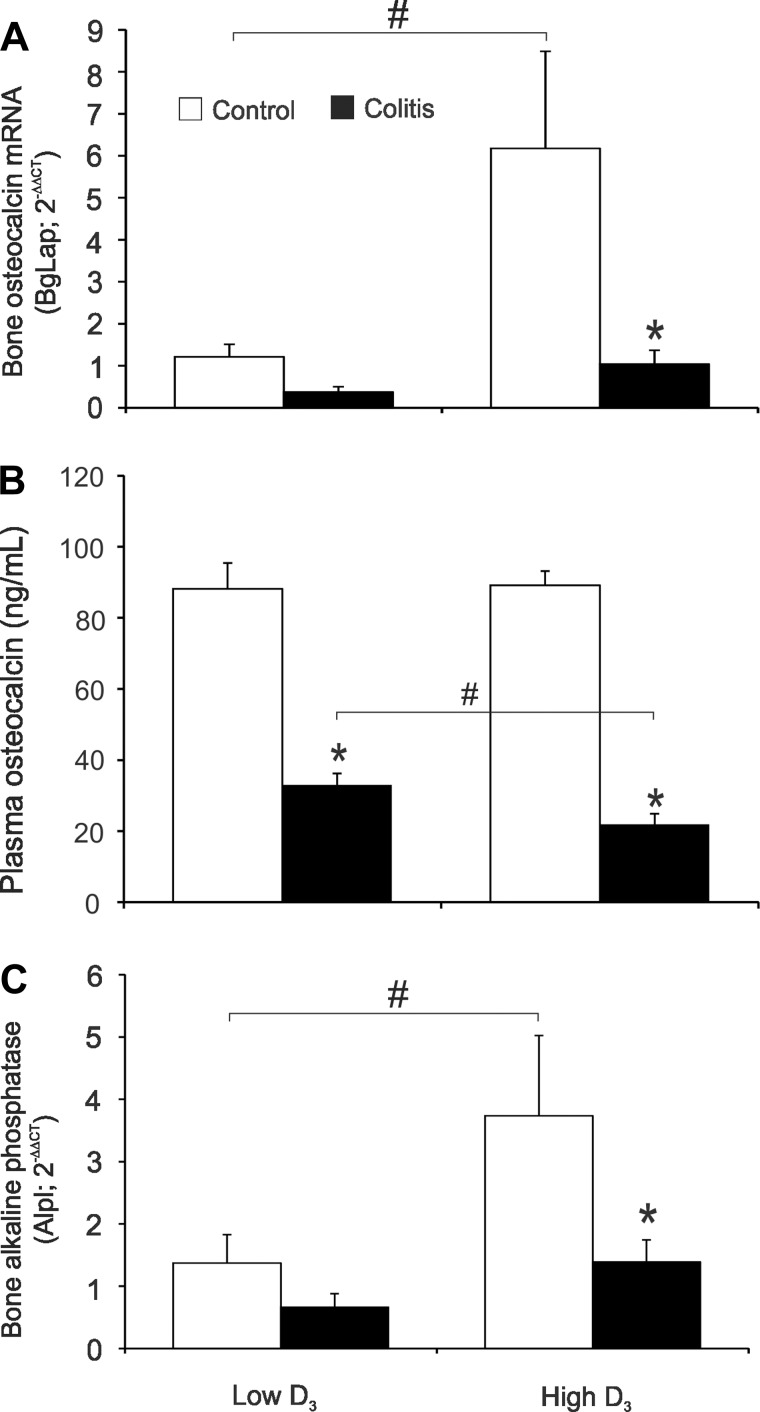
Fig. 7.
Bone formation in control and colitic mice maintained on the low vitamin D3 diet or switched to the high vitamin D3 diet. A and C: real-time RT-PCR analysis of bone osteocalcin [bone γ-carboxyglutamate protein (BgLap)] and bone alkaline phosphatase (Alpl) mRNA expression. Data were normalized to GAPDH mRNA as an internal control and calculated using the ΔΔCt method, with control mice on the low vitamin D3 diet used as a calibrator. B: plasma concentration of osteocalcin. Values are means ± SE; n = 5 and 7 for control and colitis groups, respectively. *P ≤ 0.05 vs. control; #P ≤ 0.05, low D3 vs. high D3 (by ANOVA followed by Fisher's PLSD post hoc test).

