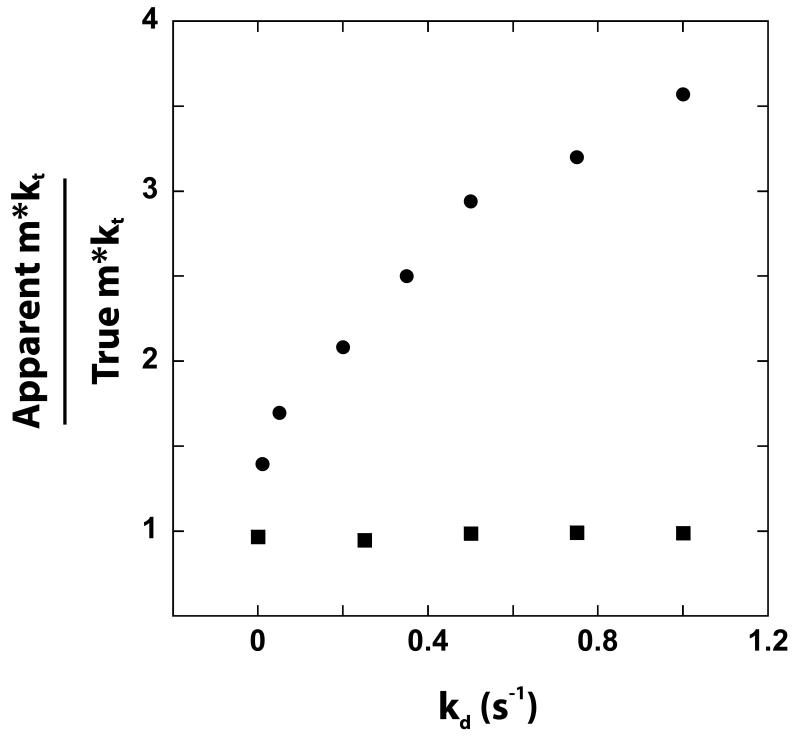
Figure 4.1.
The dependence of the ratio of the apparent value of the macroscopic translocation rate (m*kt) to the true value of m*kt used in the simulation on the value of kd used in the simulation. The apparent value of the m*kt was determined from the dependence on the length of the DNA of the maximum fluorescence signal (i.e., population of protein bound at the end of the DNA) that occurs during the time course of protein translocation along the DNA (30). In the simulations used to generate these time courses, we used constant values of kt = 30 steps/s, m = 1 nt/step, and kend = 3 s−1. Qualitatively similar results are obtained with other sets of parameters (data not shown).

