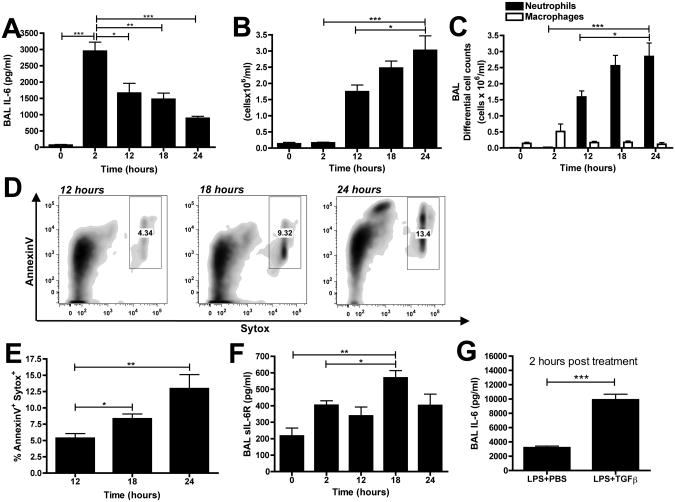
Figure 4. IL-6 production peaks at 2 hours following LPS challenge.
WT mice were challenged via intratracheal administration of 10μg LPS and BAL samples were collected at 0, 2, 12, 18 and 24 hours. (A) Total and (B) differential cell counts were performed on BAL samples. (C) BAL supernatants were analysed for IL-6 production by ELISA. (D) Representative flow plots of BAL cells (gating on Gr-1+ cells) with (E) quantification of dead neutrophils. (F) sIL-6R levels were measured in BAL supernatants by ELISA. (G) BAL supernatants were analysed for IL-6 production by ELISA with or without 5ng rTGFβ1. n=6 mice per group from 2 independent experiments. Data is represented as mean ± SEM.

