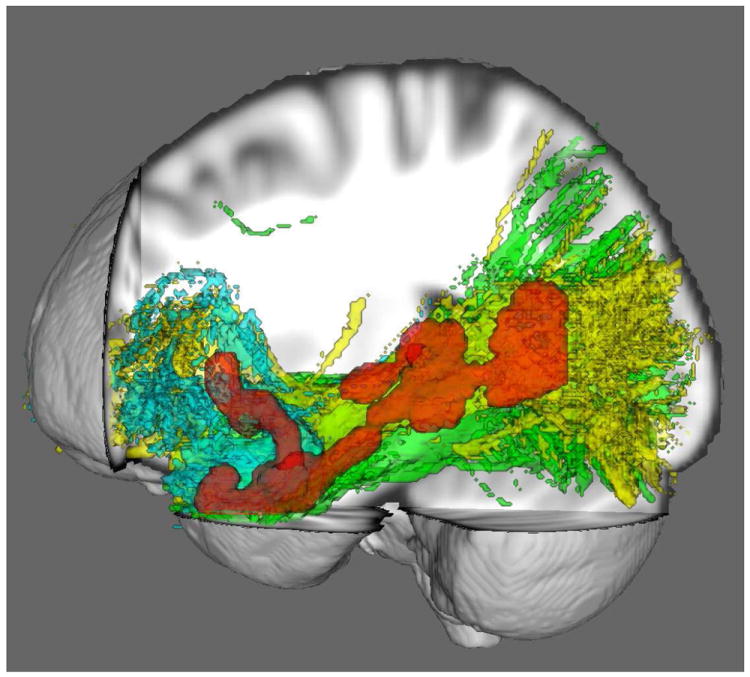
Figure 4. Three-dimensional rendering of TBSS statistical analysis.

Adolescent BPD patients showed a reduced FA throughout the temporal lobe (shown in red; p < 0.05, family wise error corrected for multiple comparisons). FA differences are projected onto the white matter tracts for reference: the uncinate fasciculus in blue, occipitofronal fasciculus in yellow, and the inferior longitudinal fasciculus in green.
