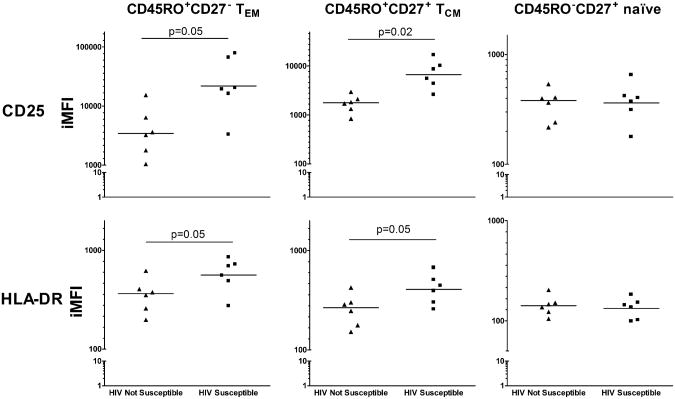
Figure 3. Expression of activation markers on TCM and TEM cells correlates with HIV susceptibility.
Integrated mean fluorescent indices (iMFI) for CD25 (top) and HLA-DR (bottom) gated on viable CD3+CD4+ lymphocytes and appropriate CD45RO and CD27 expression. N=6 for each group. Lines indicate geometric mean of iMFI. Statistics calculated by t test.

