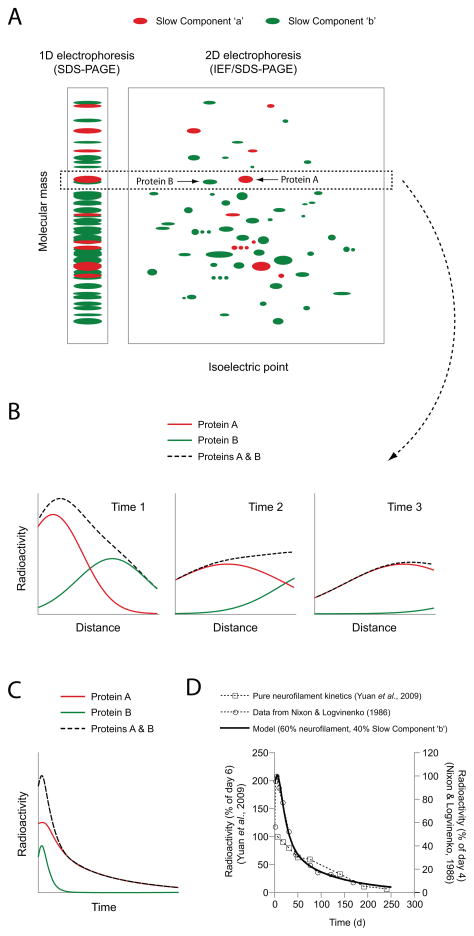
Figure 2. Contamination of the neurofilament transport kinetics in mouse optic nerve by Slow Component ‘b’ proteins.
A. Schematic diagram of hypothetical radiolabeled axonal proteins resolved by one dimensional (1D) gel electrophoresis, i.e. sodium dodecyl sulfate polyacrylamide gel electrophoresis (SDS-PAGE), or two dimensional (2D) gel electrophoresis, i.e. isoelectric focusing (IEF) in the first (horizontal) dimension and SDS-PAGE in the second (vertical) dimension. Slow Component ‘a’ proteins (which are relatively few) are shown in red and Slow Component ‘b’ proteins (which are relatively numerous) are shown in green. The box demarcated with the dashed line shows a hypothetical Slow Component ‘a’ protein, Protein A, and a hypothetical Slow Component ‘b’ protein of similar molecular mass, Protein B. These proteins comigrate using 1D electrophoresis, but can be resolved using 2D electrophoresis because they have different isoelectric points. B. Schematic representation of the distribution of a pulse of these radiolabeled proteins along a hypothetical short nerve (meant to be representative of the optic nerve) at three different time points. Radioactivity associated with Protein A, which moves more slowly (in Slow Component ‘a’), is shown in red. Radioactivity associated with Protein B, which is transported more rapidly (in Slow Component ‘b’), is shown in green. The dashed black line represents the sum of the radioactivity profiles for the two proteins and is representative of the profile that would be observed if the analysis was performed using 1D electrophoresis of total nerve protein, as in Nixon & Logvinenko (1986). C. Schematic representation of the time course of appearance and disappearance of radioactive protein in the entire nerve window over time. Note that Protein B, which moves in Slow Component ‘b’, enters and exits the nerve window more rapidly than Protein A. The decay kinetics of the individual proteins are monophasic, but the decay kinetics of the two proteins combined (dashed black line) is biphasic. The initially more rapidly declining phase corresponds to Protein B, which departs the nerve more rapidly, and the later more slowly declining phase corresponds to Protein A, which departs more slowly. D. The experimental data of Nixon and colleagues, as plotted in Li et al. (2012). The symbols represent the data for neurofilament protein M from Yuan et al. (2009) (open squares) and from Nixon & Logvinenko (1986) (open circles). Yuan et al. (2009) used a Triton-insoluble protein fraction, yielding pure neurofilament protein and monophasic decay kinetics. In contrast, Nixon & Logvinenko (1986) used total nerve protein (soluble and insoluble), yielding biphasic decay kinetics. The solid black line represents the output of the model, assuming contamination of the neurofilament protein kinetics with a hypothetical Slow Component ‘b’ protein (relative weighting of 60% neurofilament protein and 40% Slow Component ‘b’ protein). Note that the model shows good agreement with the biphasic decay kinetics of Nixon & Logvinenko (1986) at all times, and also with the monophasic decay kinetics of Yuan et al. (2009) at later times (>50 days), after the Slow Component ‘b’ proteins in the model have left the nerve window. Thus the biphasic decay kinetics of Nixon & Logvinenko (1986) can be explained by contamination of the neurofilament transport kinetics with faster moving Slow Component ‘b’ proteins.

