
Figure 2.
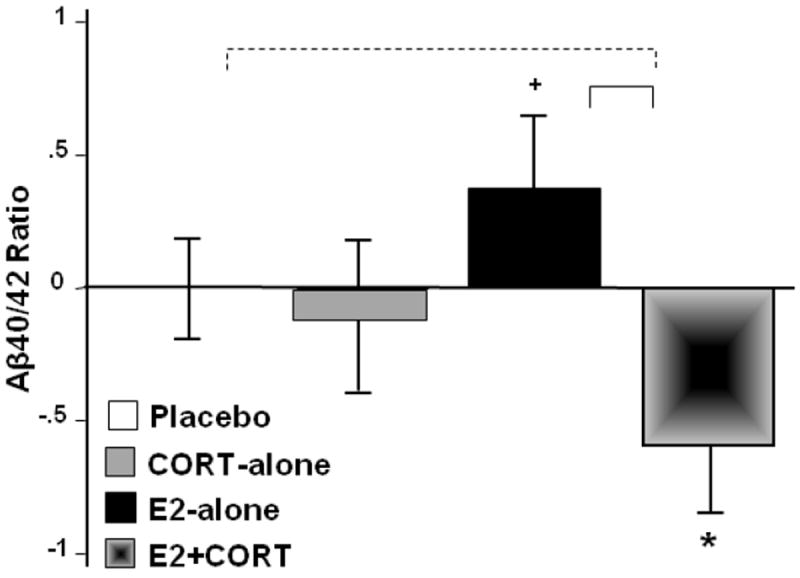
Mean (SE) change at week 8 relative to baseline, expressed as residual values, in fasting plasma concentrations of Aβ40 (pg/mL) to Aβ42 (pg/mL) ratio (N=37; missing data for 1 sub/CORT-tx group) across the four treatment arms. Brackets indicate group differences in treatment response (solid, p<0.05; dashed, p<0.10, 2-tailed) and symbols indicate change from baseline (*p<0.05; +p<0.10, 2-tailed).