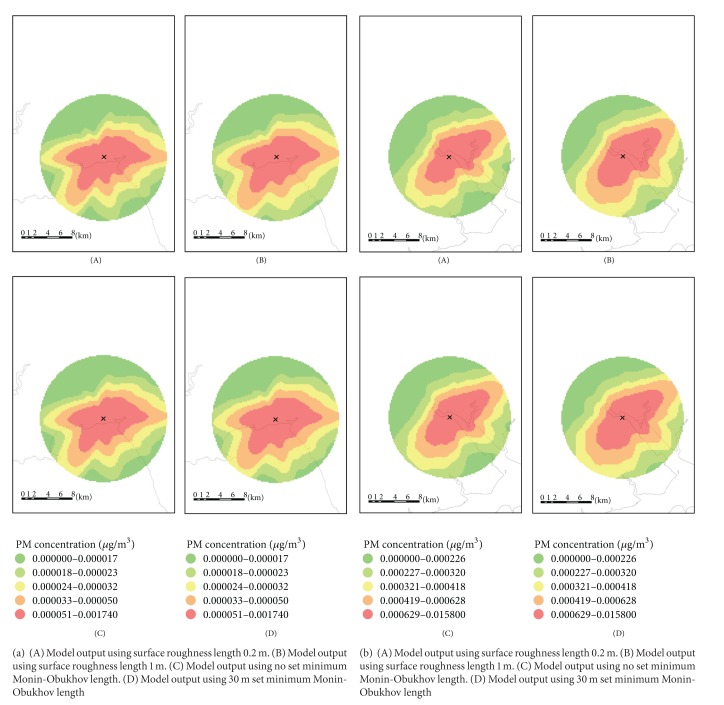
Figure 4.
(a) Sensitivity of the model to site surface roughness length and minimum Monin-Obukhov length for Crymlyn Burrows. Maps (A)–(D) use the same meteorological station data for 2003. (b) Sensitivity of the model to site surface roughness length and minimum Monin-Obukhov length for Marchwood. Maps (A)–(D) use the same meteorological station data for 2006.

