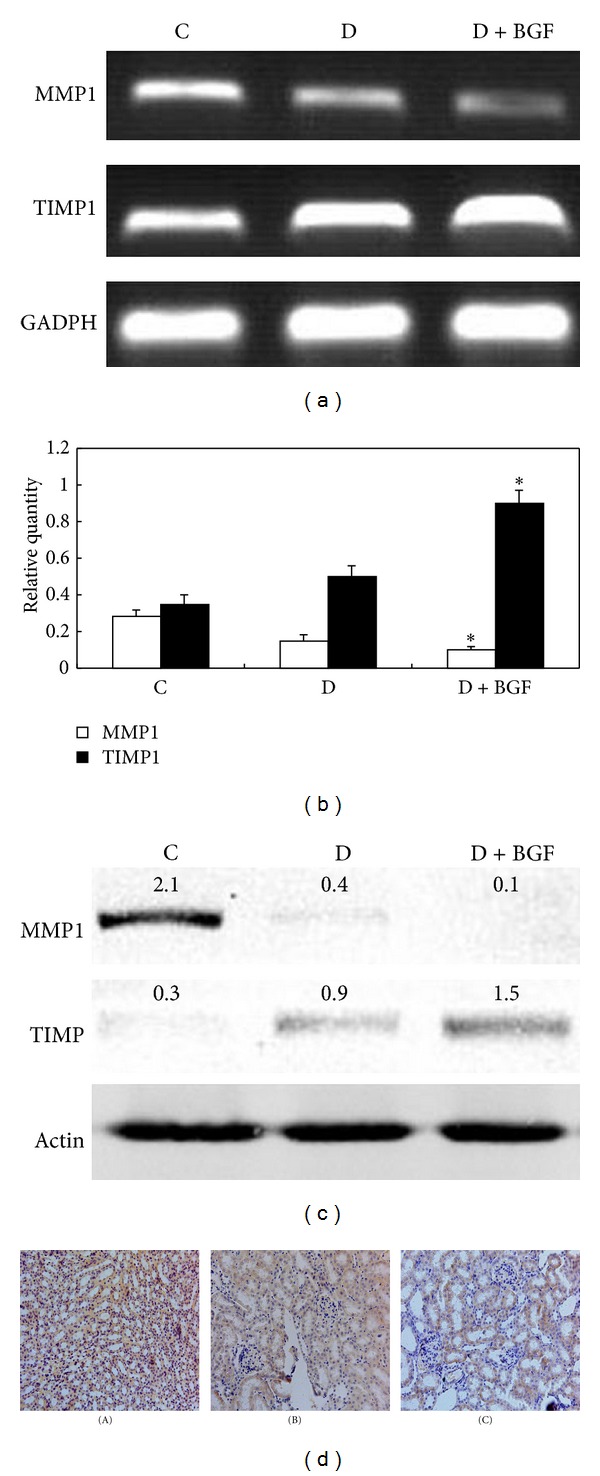
Figure 3.

BGF treatment inhibited MMP1 and activated TIMP1. (a) MMP1 and TIMP1 expression in the kidney was evaluated by RT-PCR. (b) GAPDH was used as an internal control. PCR products were semiquantified according to the ratio of type I procollagen mRNA to GAPDH mRNA (b). Data are expressed as the mean ± SEM of three separate experiments. *P < 0.05 as compared to the control. (c) Western blot analysis depicted protein levels of MMP1 and TIMP1 in the kidney of mice. (d) Immunohistological staining of MMP1 in the kidney of mice. The rate of MMP1 positivity in the BGF-treated mice (C) was lower than the normal (A) and diabetic (B) mice. Magnification: 200x.
