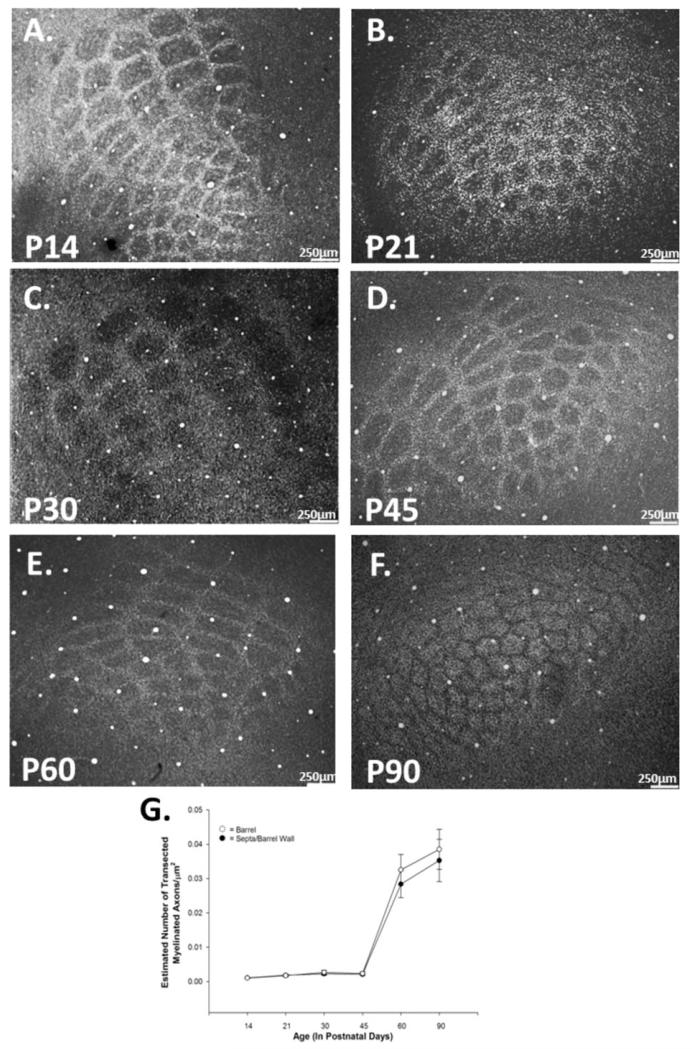
Figure 3.
Density of myelinated axons increases significantly during development. Control tissue stained for myelin at P14 (A), P21 (B), P30 (C), P45 (D), P60 (E), and P90 (F). Myelination increases over normal development in both the barrel hollow and septal/barrel wall regions. Quantification of myelinated axonal density (G) reveals a significant increase between P45 and P60 in the barrel [F(5,26) = 22.304, p < 0.001] and in the septa [F(5,26) = 28.616, p < 0.001]. Data points represent population means and one standard error of the mean.

