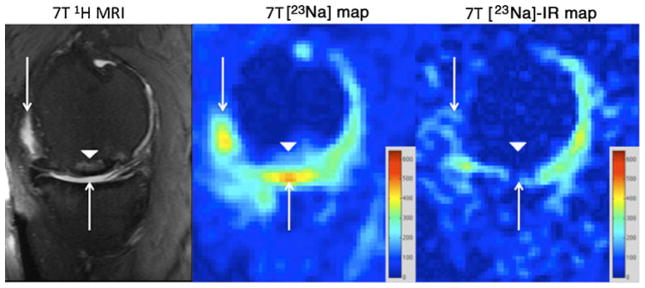
Fig. 1.

Sagittal T2-weighted 7-T MR image (left panel) of the right knee demonstrating an osteochondral allograft (arrowhead) at the weight-bearing aspect of the medial femoral condyle. There is synovial fluid at the articular surface (arrows). On the conventional 23Na concentration map (middle panel), hyperintense signal is seen from synovial fluid at the articular surface (arrows) and to a lesser extent in a subchondral location at the repair site (arrowhead). On the sodium concentration map generated from 23Na-IR MRI (right panel), there is suppression of signal from free sodium within synovial fluid (arrows) and also in the subchondral location (arrowhead). The sodium images represent concentration maps with coloured bars indicating range of [Na+] in mM (red=600 mM, blue=0 mM). The larger apparent joint space size on sodium maps compared with proton images is likely due to partial volume averaging from the lower resolution of the sodium maps (2 mm×2 mm×2 mm vs 0.546 mm×0.546 mm×2 mm)
