
Fig. 2.
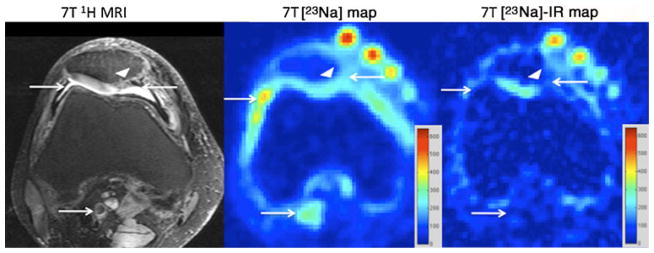
Axial T2-weighted 7-T MR image (left panel) of the right knee, demonstrating a juvenile cartilage cell implantation (arrowhead) at the medial facet of the patella. Structures containing free sodium, such as synovial fluid and popliteal vessels, are indicated by arrows. On the conventional 23Na maps (middle panel), hyperintense signal is seen from synovial fluid at the articular surface and within the popliteal vessels (arrows). On the 23Na-IR map (right panel), there is suppression of signal from free sodium within synovial fluid and within popliteal vessels (arrows). The calibration phantoms containing 300 mM, 250 mM, 200 mM and 150 mM are seen at the anterior aspect of the knee. The sodium images represent concentration maps with coloured bars indicating range of [Na+] in mM (red=600 mM, blue= 0 mM)