Fig. 5.
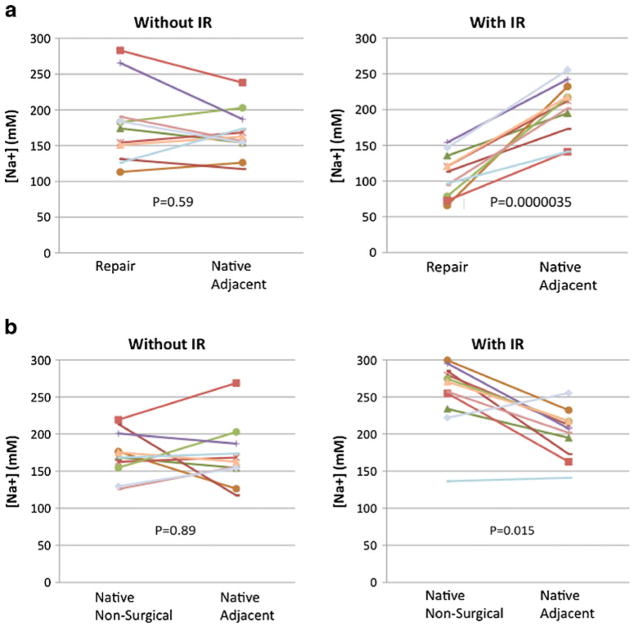
a Graphs indicating the sodium concentrations for cartilage repair tissue and native adjacent cartilage tissue for each patient, calculated from both conventional 23Na maps and 23Na-IR maps. A statistically significant decrease in mean repair tissue sodium concentration is detected on 23 Na-IR maps (P=0.0000035), but not on conventional 23Na maps (P=0.59). b Graphs indicating the sodium concentrations for native cartilage adjacent to the repair site and native cartilage tissue within a different compartment not involved in surgery. This was calculated for each patient, from both conventional 23Na maps and 23Na-IR maps. A statistically significant decrease in adjacent native cartilage sodium concentration compared with native cartilage within a non-surgical compartment is detected on 23Na-IR maps (P=0.015), but not on conventional 23Na maps (P=0.89)

