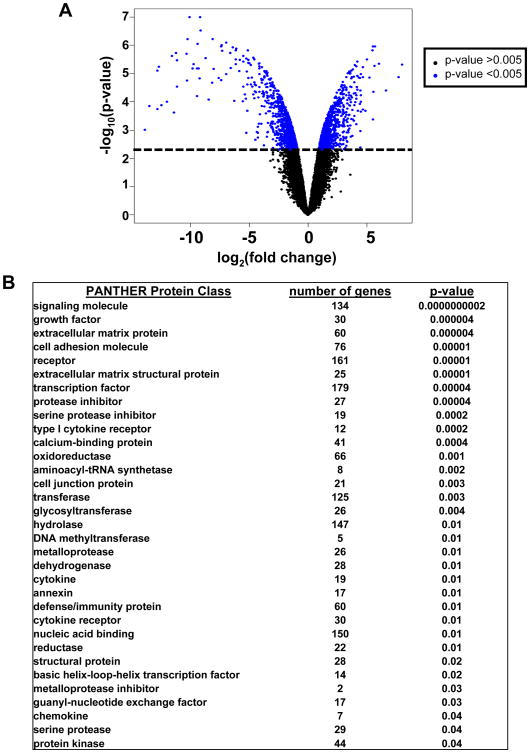
Fig. 2. Differentially expressed genes in mtDNA-depleted human skin fibroblasts (HSF ρ0) compared with their parental cells (HSF ρ+).
A. Comparison of gene expression was performed using microarrays. The log transformed fold change in relative gene expression is plotted on the x-axis and the log transformed p-value is plotted on the y-axis. Each point in the graph represents an individual gene. Genes towards the top of the graph have a lower p-value and the genes further to the left and the right of the x-axis have greater fold change between classes. From paired class comparison of HSF ρ0 and HSF ρ+ gene expression, there were 2100 genes that were differentially expressed between the two conditions, FDR<0.04. B. Gene ontology analysis using PANTHER showing functional enrichment of genes, number of genes in each protein class is indicated out of the 2100 differentially expressed genes. Categories are ordered by significance (p-values).

