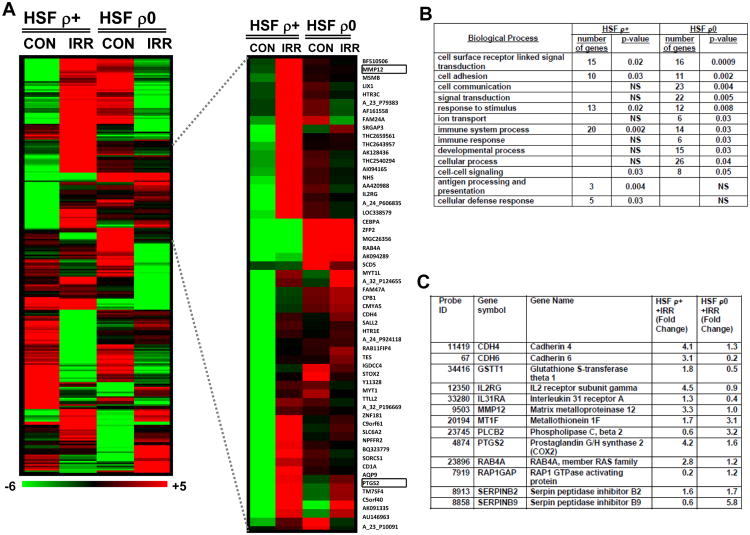
Fig. 3. Hierarchical clustering of gene expression after alpha irradiation of HSF ρ0 compared with HSF ρ+.
A. HSF gene expression responses at 4 hours after irradiation with 0.5 Gy alpha-particles; the heatmap of differentially expressed 265 genes was made using BRB tools (http://linus.nci.nih.gov/BRB-ArrayTools.html). The inset displays a subset of the differentially expressed genes showing MMP12 and PTGS2 gene expression. The scale bar indicates induced (red) and repressed (green) expression ratios. B. Gene ontology analysis using PANTHER biological processes comparing HSF ρ0 to ρ+ gene expression response after irradiation with 0.5 Gy α-particles. Functionally enriched categories are shown, p-values indicate statistical significance, p-value cut off 0.05 and NS is not significant. C. Expression levels of selected genes in HSF ρ0 compared with HSF ρ+ 4 hours after irradiation.

