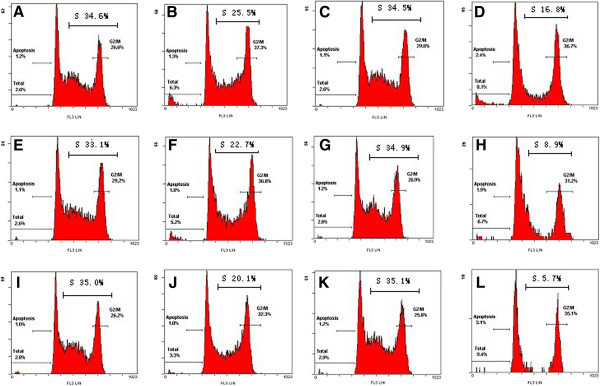
Figure 4.

Flow cytometry (FCM) analysis. Sarcoma 180 cells were cultured with the methods described above and treated with different concentrations of PTL ranging from 0-40 μg/ml for 12 h and 24 h. For each analysis, a minimum of 10,000 cells were counted. A, E, I is the control for 12h and C, G, K is the control for 24 h, the incubating time is 12 h for B, F, J and 24 h for D, H, L. the concentration of PTL is 5 μg/ml for B and D, 20 μg/ml for F and H and 40 μg/m for J and L.
