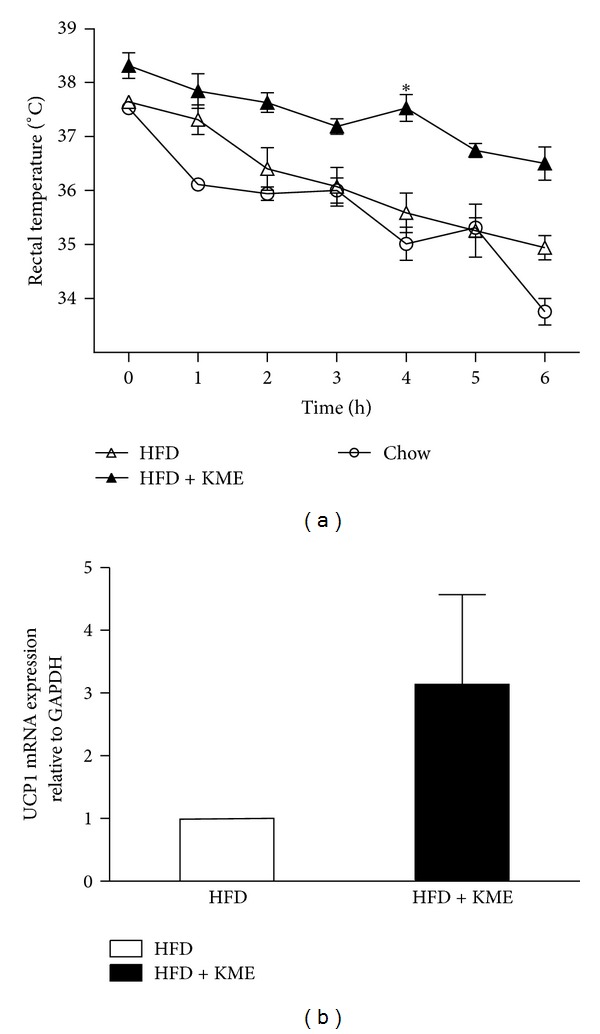
Figure 2.

effect of KME on body temperature during the cold test (4°C for 6 h) and on UCP1 mRNA expression in BAT. (a) Hourly changes in body temperature are shown. (△) HFD: high-fat diet; (▲) HFD + KME: high-fat diet plus KME 3000 mg/kg (*P < 0.05, n = 7 per group). (b) The relative UCP1 mRNA expression level in BAT of animals treated with HFD or HFD + KME (high-fat diet plus KME 3000 mg/kg) as quantified by real-time PCR. Values represent mean ± SEM (*P < 0.05, n = 3).
