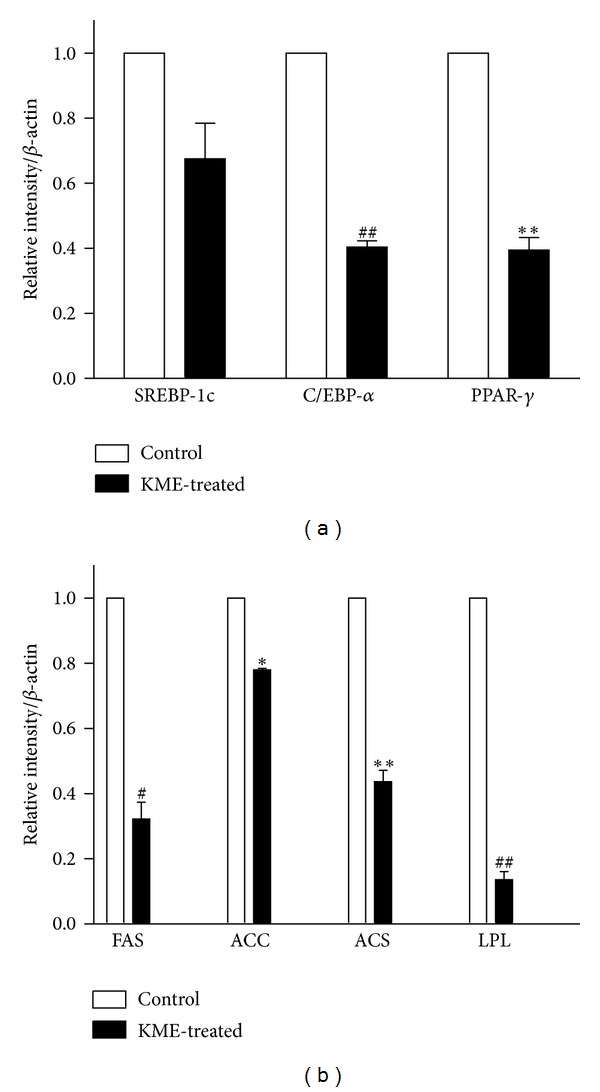
Figure 5.

mRNA expressions of adipogenic enzymes and transcription factors in KME-treated 3T3-L1 adipocytes. On day 8 after differentiation, adipocytes were cultured in 6-well plates with or without KME (6 μg/μL) for 18 hours. Graphs represent mRNA expression of (a) adipogenic enzymes ACC, ACS, FAS, and LPL and (b) adipogenic transcription factors SREBP-1c, C/EBP-α, and PPAR-γ. Data are expressed relative to untreated control cells and represent the mean ± SEM (*P < 0.05, # P < 0.01, **P < 0.005, ## P < 0.001, n = 3).
