
Figure 4.
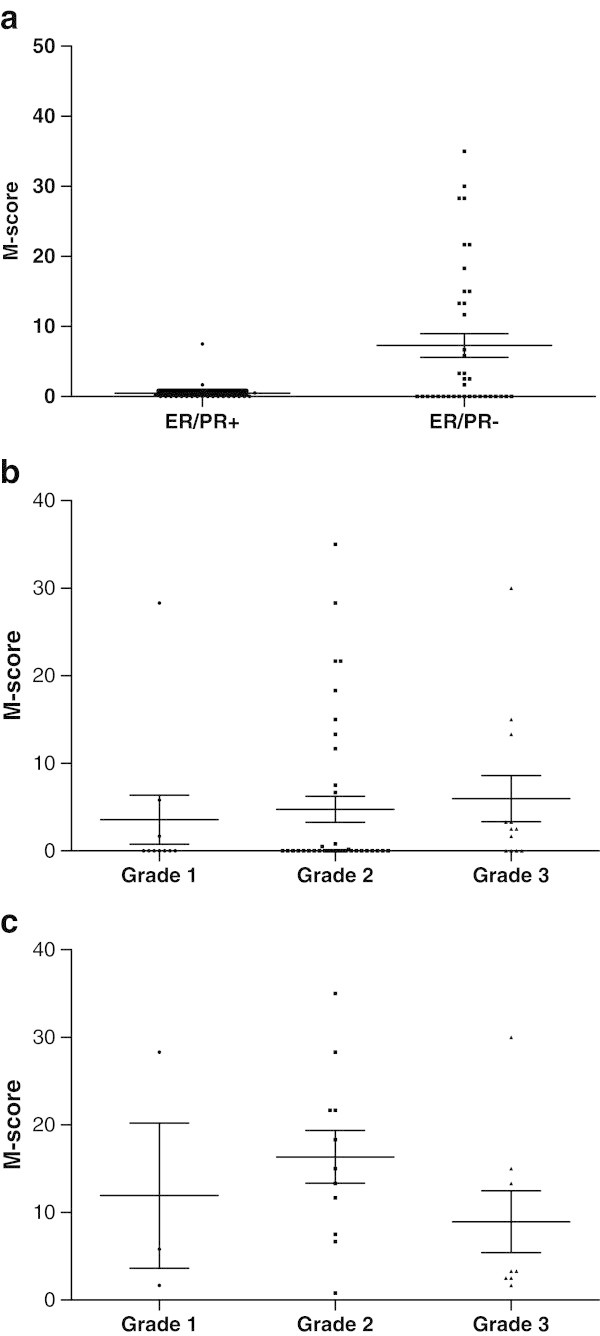
M-score Distribution of FRAExpression in Her2(−) MetastaticBreast Cancer. a Distribution of the level of FRA expression in 61 Her2(−) metastatic breast cancer samples based on molecular subtype: ER/PR(+) versus ER/PR(−) p = 0.0029 (two-tailed t-test). b Distribution of the level of FRA expression based on grade across 61 Her2(−) metastatic breast cancer samples. The differences in the means of the M-scores were not significant (one-way ANOVA). c Distribution of the level of expression of FRA across grade in FRA positive (n = 22) metastaic breast cancer samples. The differences in the means of the M-scores were not significant (one-way ANOVA).