
Figure 2.
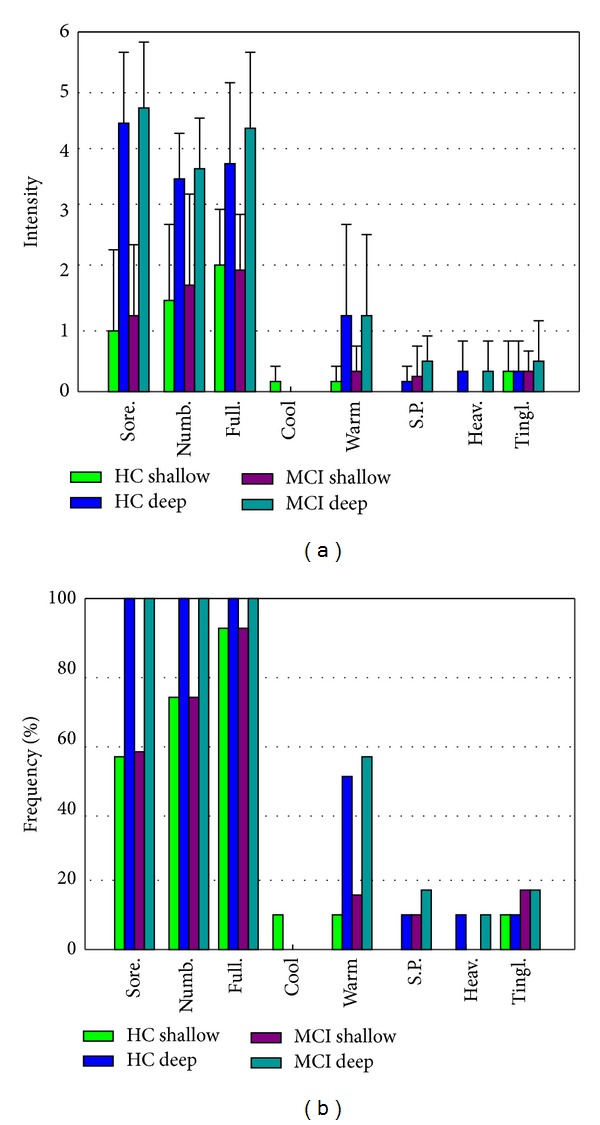
(a) The prevalence of deqi sensations. It was expressed as the percentage of the individuals in the group that reported the sensation (at least one subject experienced the seven sensations listed). (b) The intensity of sensations. It was expressed as the average score ± S.E. by measuring on a scale from 0 denoting no sensation to 10 denoting an unbearable sensation.