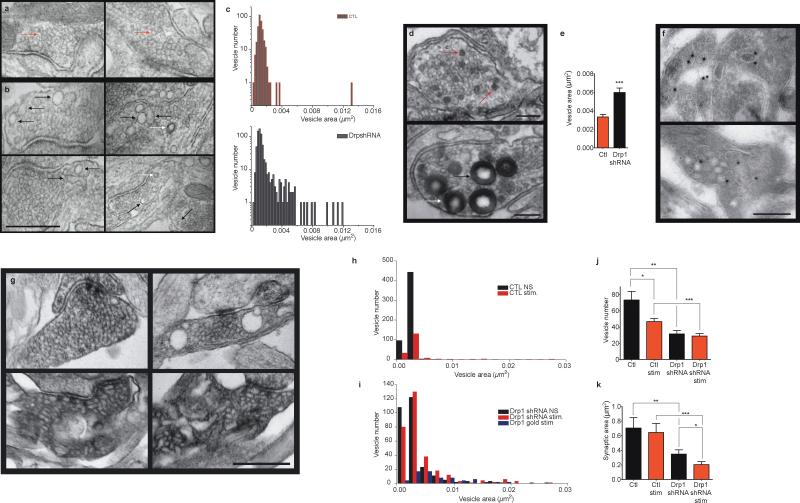
Fig. 7. Drp1 is required for formation of normal endocytotic vesicles.
a. Electron micrographs of resting synapses of hippocampal neurons transduced with scrambled GFP-shRNA. Red arrows demonstrate representative control synaptic vesicles. Scale bar is shown in 7b.
b. Electron micrographs of resting synapses of hippocampal neurons transduced with GFP-Drp1 shRNA. Black arrows indicate enlarged vesicles and (in lower right hand panel) a vesicle with an elongated neck. White arrows indicate clathrin-coated pits, which tend to be more frequently seen in micrographs of synapses of Drp1 shRNA expressing neurons. Scale bar = 500 nm.
c. Histograms of all vesicle area measurements (n=6 micrographs of scrambled shRNA expressing neurons, 347 vesicles; n=8 micrographs of Drp1 shRNA expressing neurons, 667 vesicles.
d. Electron micrographs of stimulated synapses of hippocampal neurons transduced with scrambled GFP shRNA (top image) or with GFP Drp1 shRNA (bottom image); blots were fixed just after stimulation with 90 mM KCl in the presence of horse radish peroxidase (HRP). Scale bar = 200 nm. Red arrows demonstrate HRP-labeled vesicles in controls, black arrows demonstrate HRP-labeled vesicles in Drp1 shRNA. White arrow shows an endocytotic pit pinching off the plasma membrane.
e. Quantification of area (μm2) of all HRP-labeled vesicles (n=9 images, 98 total vesicles for control; n=11 images, 127 total vesicles for Drp1 shRNA, ***p<0.0001).
f. Cryo-electron micrographs immuno-labeled with gold-tagged anti-VAMP antibodies after stimulation. Scale bar = 200 nm.
g. Electron micrographs of synapses of hippocampal neurons transduced with scrambled GFP shRNA (top images) or with GFP Drp1 shRNA (bottom images). Left panels represent unstimulated synapses, right panels represent stimulated synapses. Scale bar = 500 nm.
h-i. Histograms of all vesicle area measurements (μm2) from panels in f, g (n=8 micrographs of control scrambled shRNA unstimulated synapses, n=5 micrographs of control scrambled shRNA stimulated synapses, n=9 micrographs of Drp1 shRNA unstimulated synapses, n=12 micrographs of Drp1 shRNA stimulated synapses, n=19 micrographs of Drp1 shRNA synapses immunogold labeled with anti-VAMP antibodies).
j. Quantification of number of vesicles in synapses such as shown in g (n=9 micrographs (synapses) each for unstimulated and stimulated scrambled shRNA, 9 micrographs for unstimulated Drp1 shRNA, 11 micrographs for stimulated Drp1 shRNA; *p = 0.0306, **p = 0.002, ***p<0.0001).
k. Quantification of synapse area (μm2) of all synapses measured in j (*p=0.043; **p=0.007, ***p<0.0001). Statistics are represented as mean +/- S.E.M.

