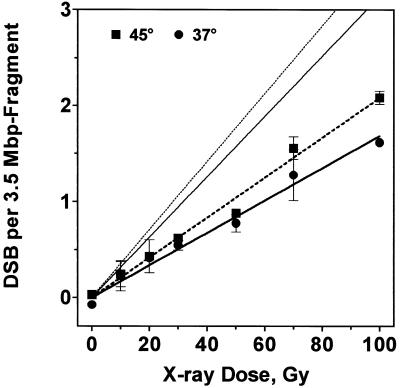
Figure 3.
From relative band intensities dsb induction rate was calculated for non-heated and preheated cells (circles and squares) and fitted by linear regression. Alternatively, intensity profiles of lanes of the Southern blot (as shown in Fig. 2B) were used to calculate dsb rate (see text), giving 2-fold higher rates (straight lines without symbols).

