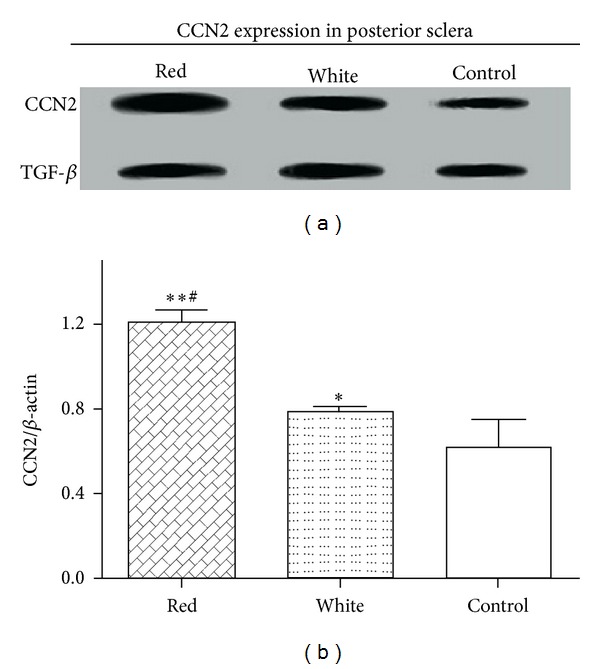
Figure 2.

CCN2 protein expression in posterior sclera tissues after light exposure. (a) The protein level of CCN2 was detected by Western blot analysis. (b) The relative CCN2/β-actin protein level was evaluated in posterior sclera tissues. *P < 0.05 indicates significant differences from control; **P < 0.01 indicates significant difference from control. # P < 0.01 indicates significant difference from white light group.
