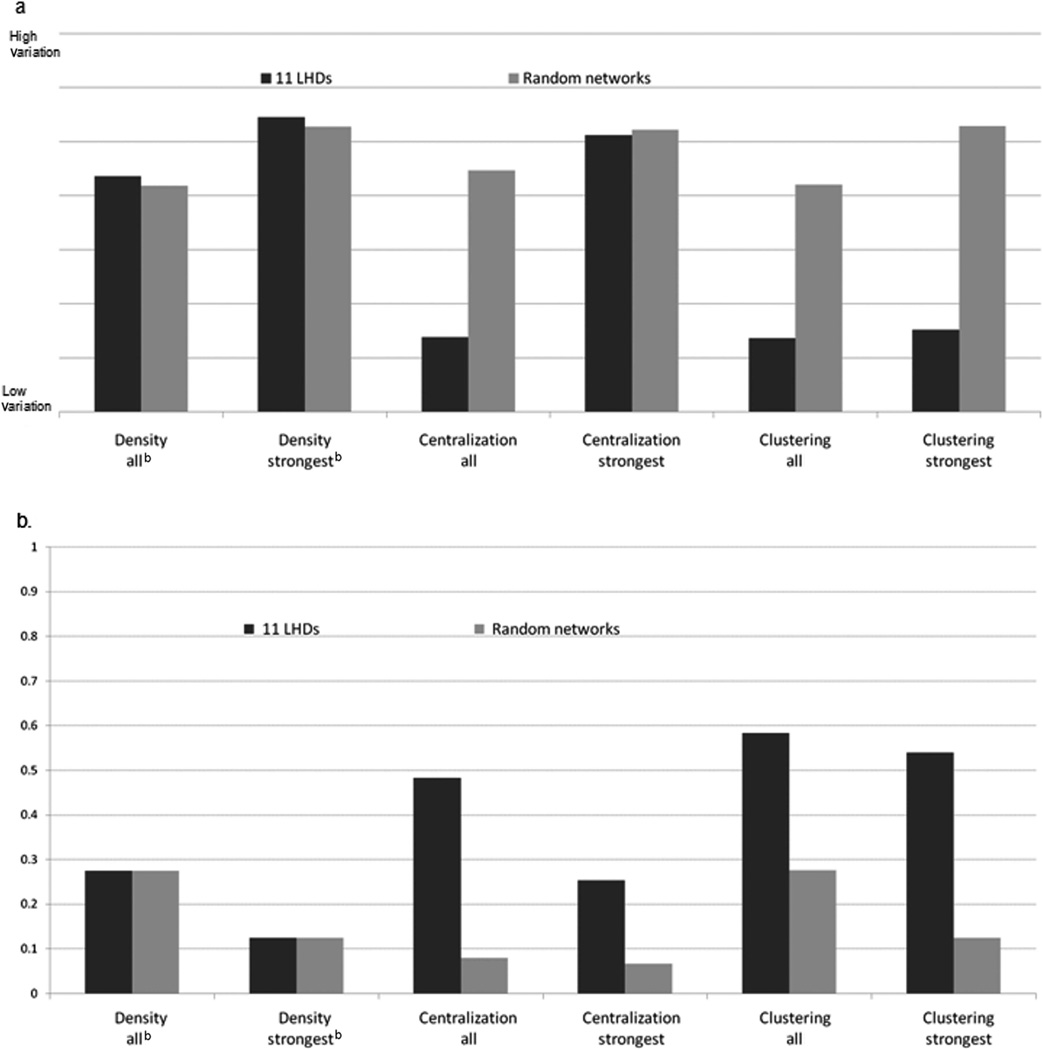
FIGURE 3. Bar Graphs Showing the Coefficients of Variation (a) and the Means (b) for 11 Local Health Departments (LHDs) Compared With a Set of Randomly Generated Networks*.
*Comparisons are illustrated for employee communication networks. A set of five random networks was generated for each LHD on the basis of the same density. The y-axis in (a) represents a scale for the coefficient of variation, which is a relative term, in which a higher value indicates more variability. LHD networks exhibit much less variability in centralization of their all ties networks and in clustering than random networks. The y-axis in (b) represents mean network measurements (normalized between 0 and 1). LHD networks are more centralized and exhibit more clustering than expected in random networks.

