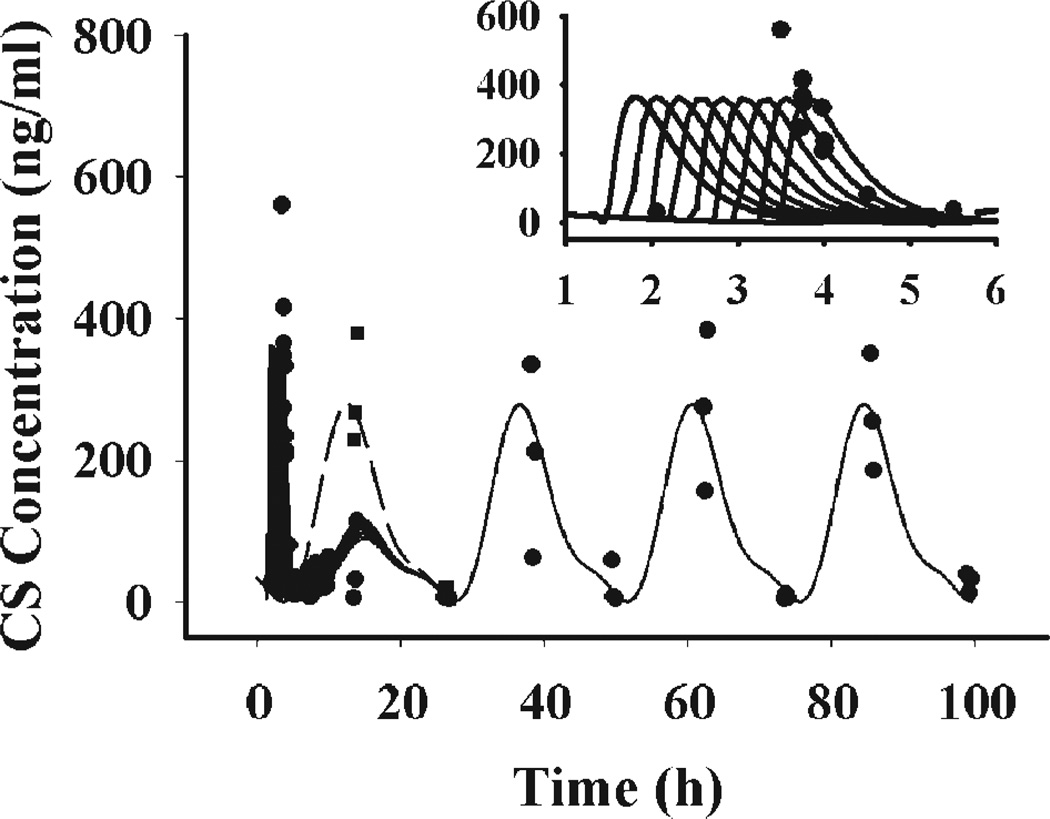
Figure 3.
Time course of plasma CS following 50 mg/ kg MPL in normal rats. Solid dots (●) and solid squares (■) represent individual data of MPL and vehicle-treated animals. Solid lines represent the model fitted curves at treatment times of 1.5, 1.75, 2, 2.25, 2.5, 2.75, 3, 3.25, and 3.5 h. The dashed line is plasma CS circadian rhythm under no drug treatment. The right upper panel shows the data with fitted curves during the early period.

