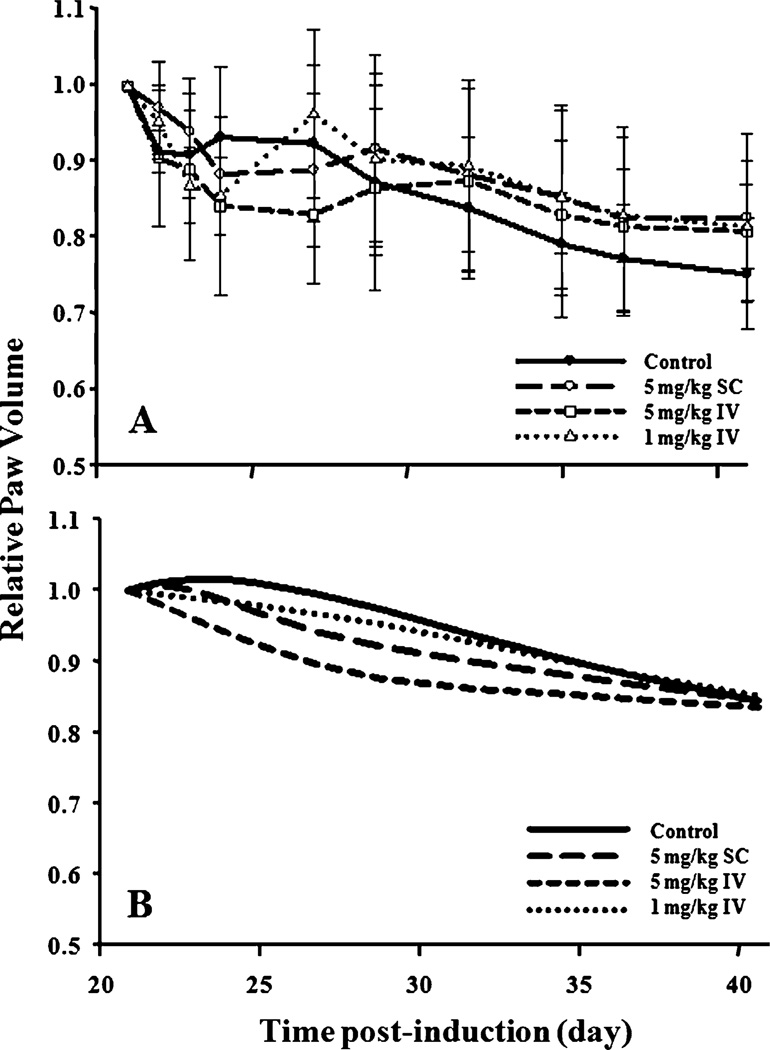
Fig. 4.
Relative paw volume vs. time profiles after etanercept administration. Data were normalized with the paw size value at peak of edema (day 21). (A) Mean ± SD observed relative paw volume in the four groups. Symbols and curves are the mean values; the error bars are the standard deviations. (B) Predicted relative paw volumes in the four groups.

